The Cognavitron — hover for details · click to navigate · double-click for full size
Wildlife Camera Surveys
2026-06-17
Wildlife Underpass Camera Study
Highway underpasses are built to let wildlife cross beneath roads — but do animals actually use them? And if you modify the structure, do they use it more? These are simple questions with complicated answers, and answering them requires data at a scale that is hard to collect.
This project was a camera trap survey of wildlife use of eight highway underpasses in San Diego County, conducted in 2012–2013 while I was at the USGS Western Ecological Research Center. Cheryl Brehme and Carlton Rochester (USGS WERC) were co-investigators. I designed the study, installed and serviced the cameras, and managed the data.
The project started as field ecology. It became, without quite intending it, the origin of a deep learning research program.
Study Design
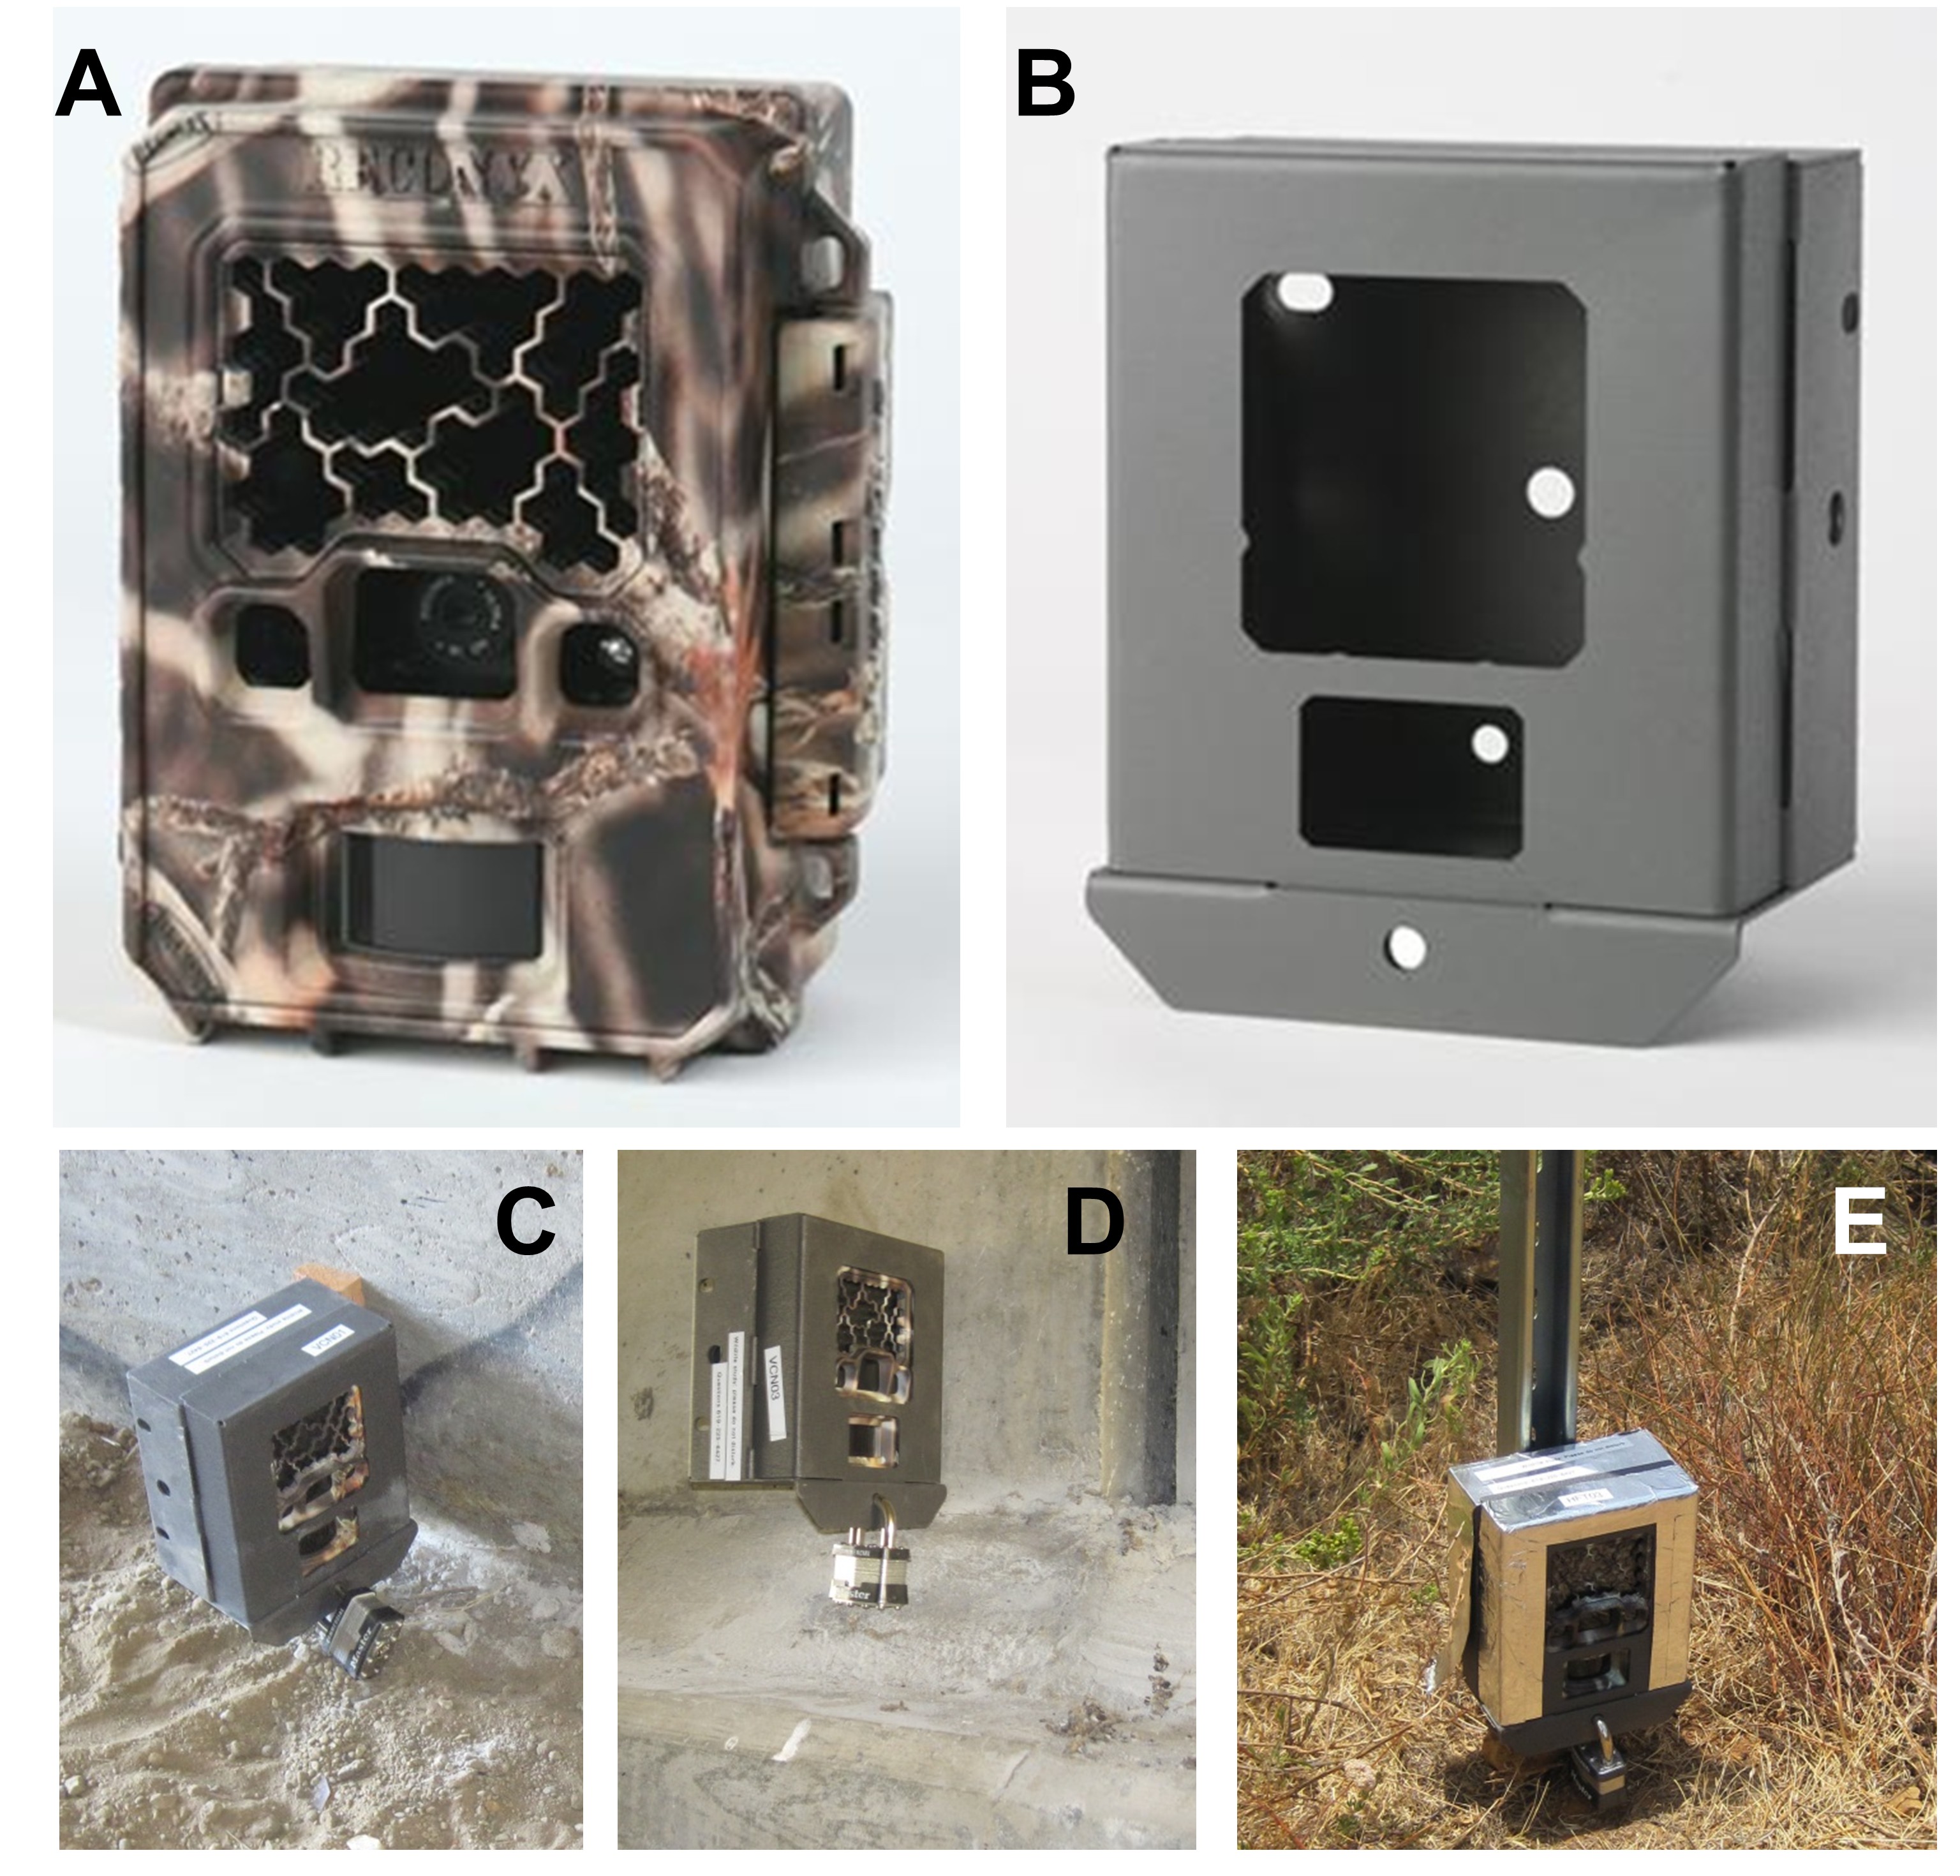
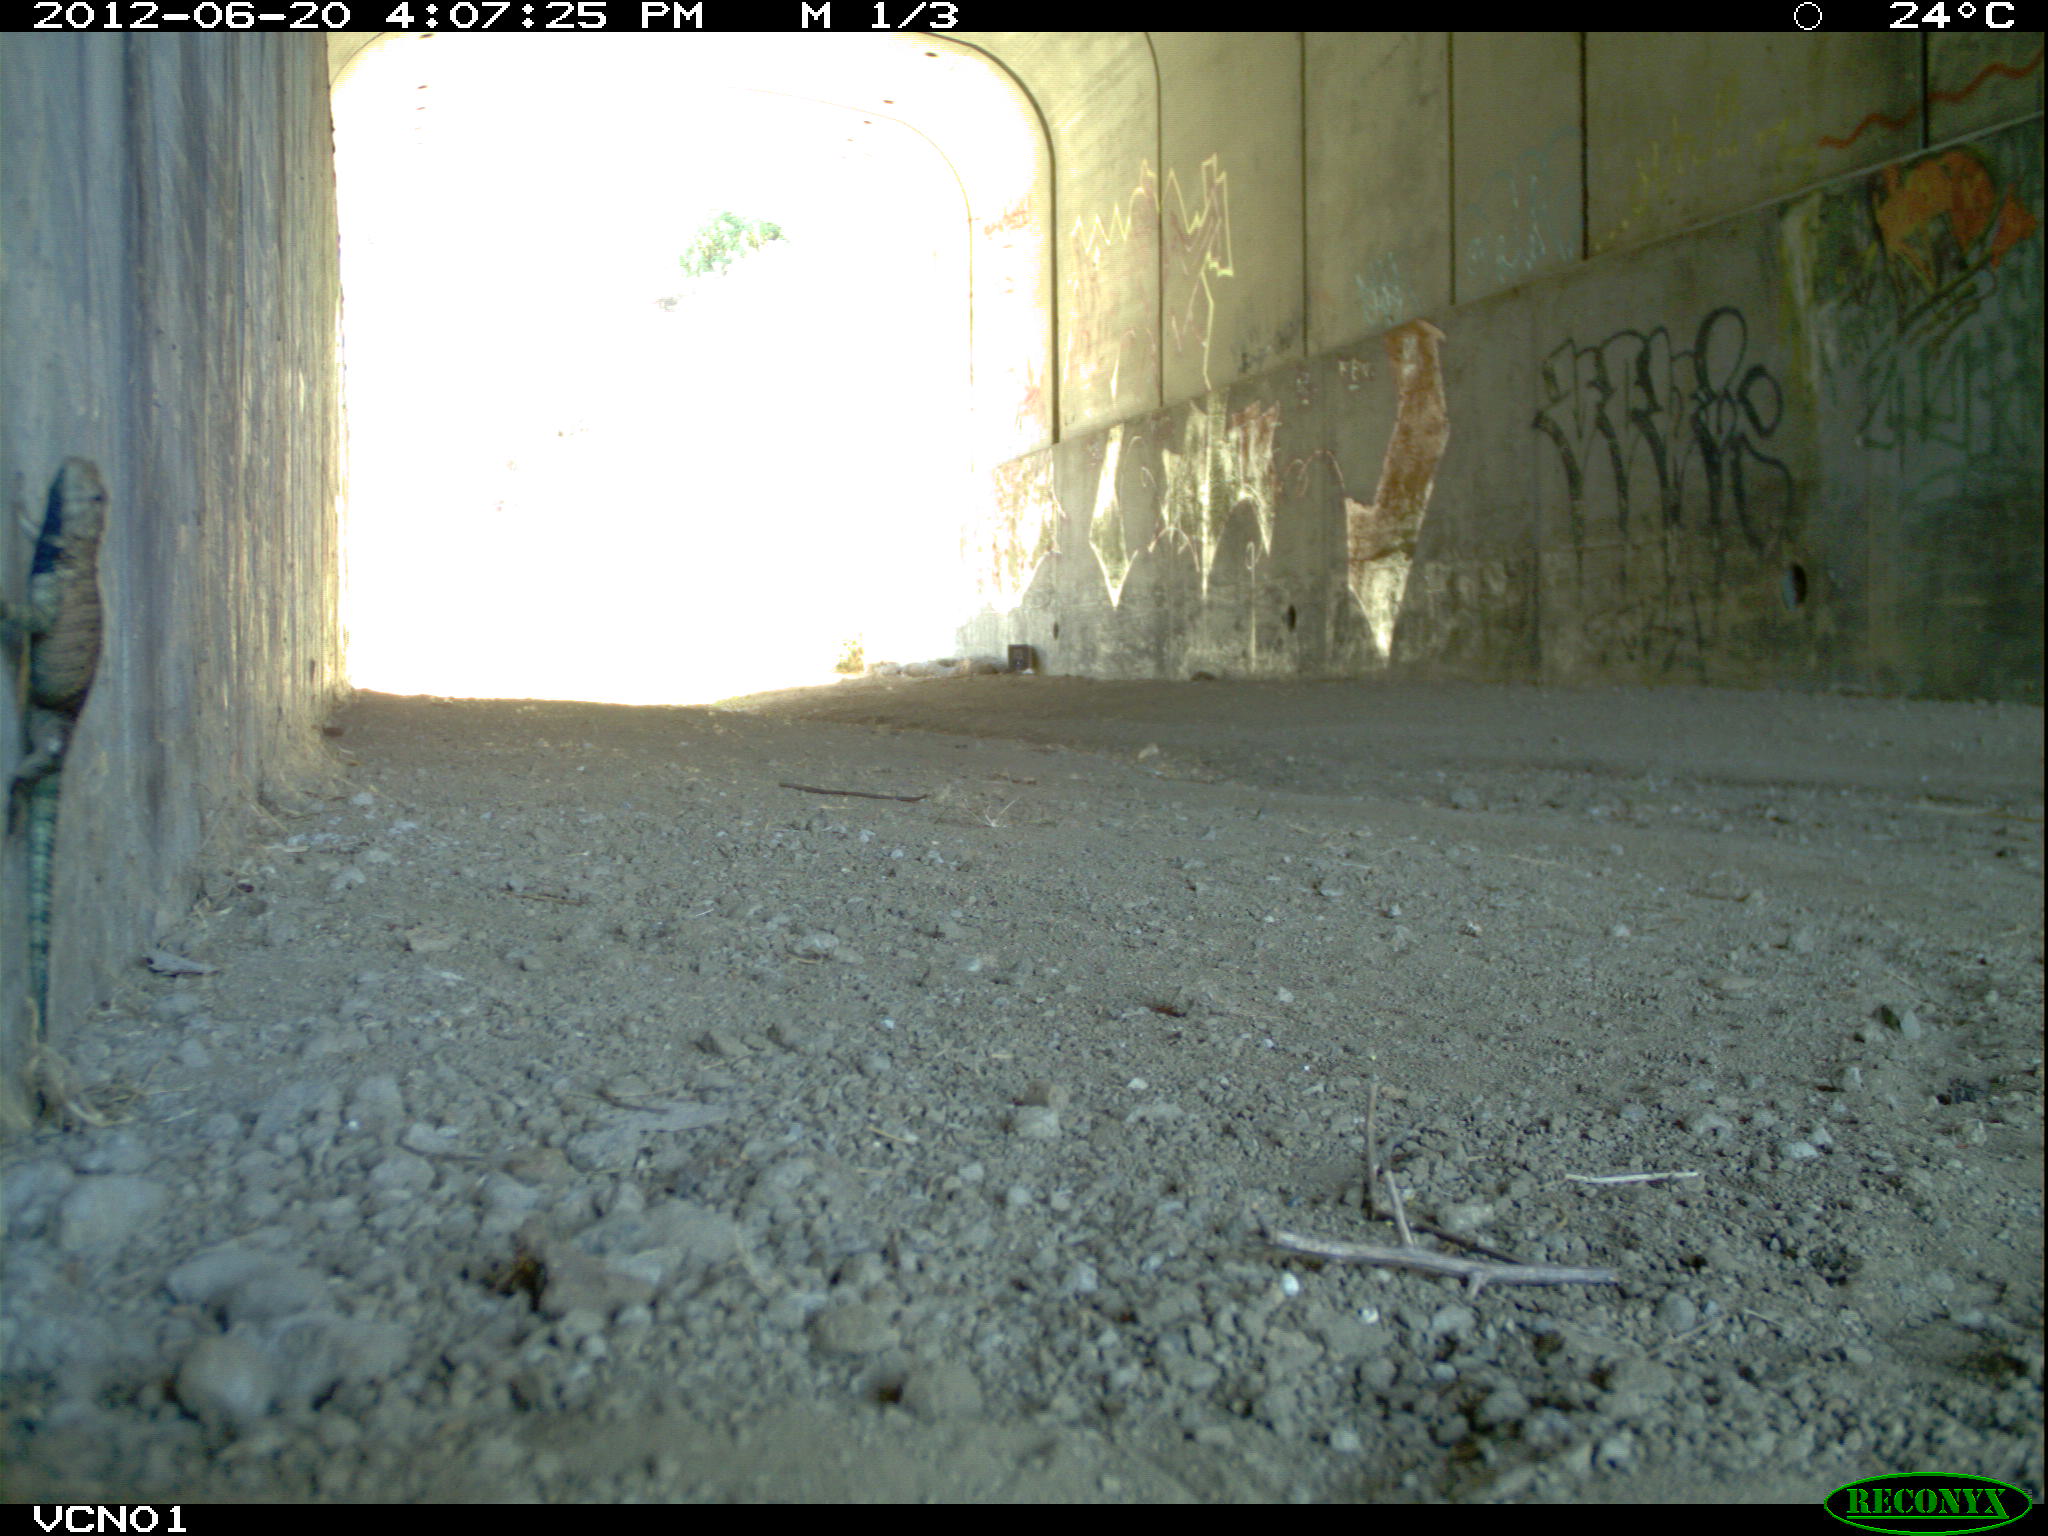
Eight underpasses spanning five highway corridors were monitored using Reconyx PC800 HyperFire camera traps — one of the most reliable systems available for long-term unattended deployment. Cameras were placed at the interior and exterior of each underpass to capture both passage events and approach behavior.
The study used a Before-After Control-Impact (BACI) design: half the underpasses received structural modifications intended to reduce the perceived exposure of animals crossing, while the others served as controls. Data were collected across two seasons to support before/after comparisons.
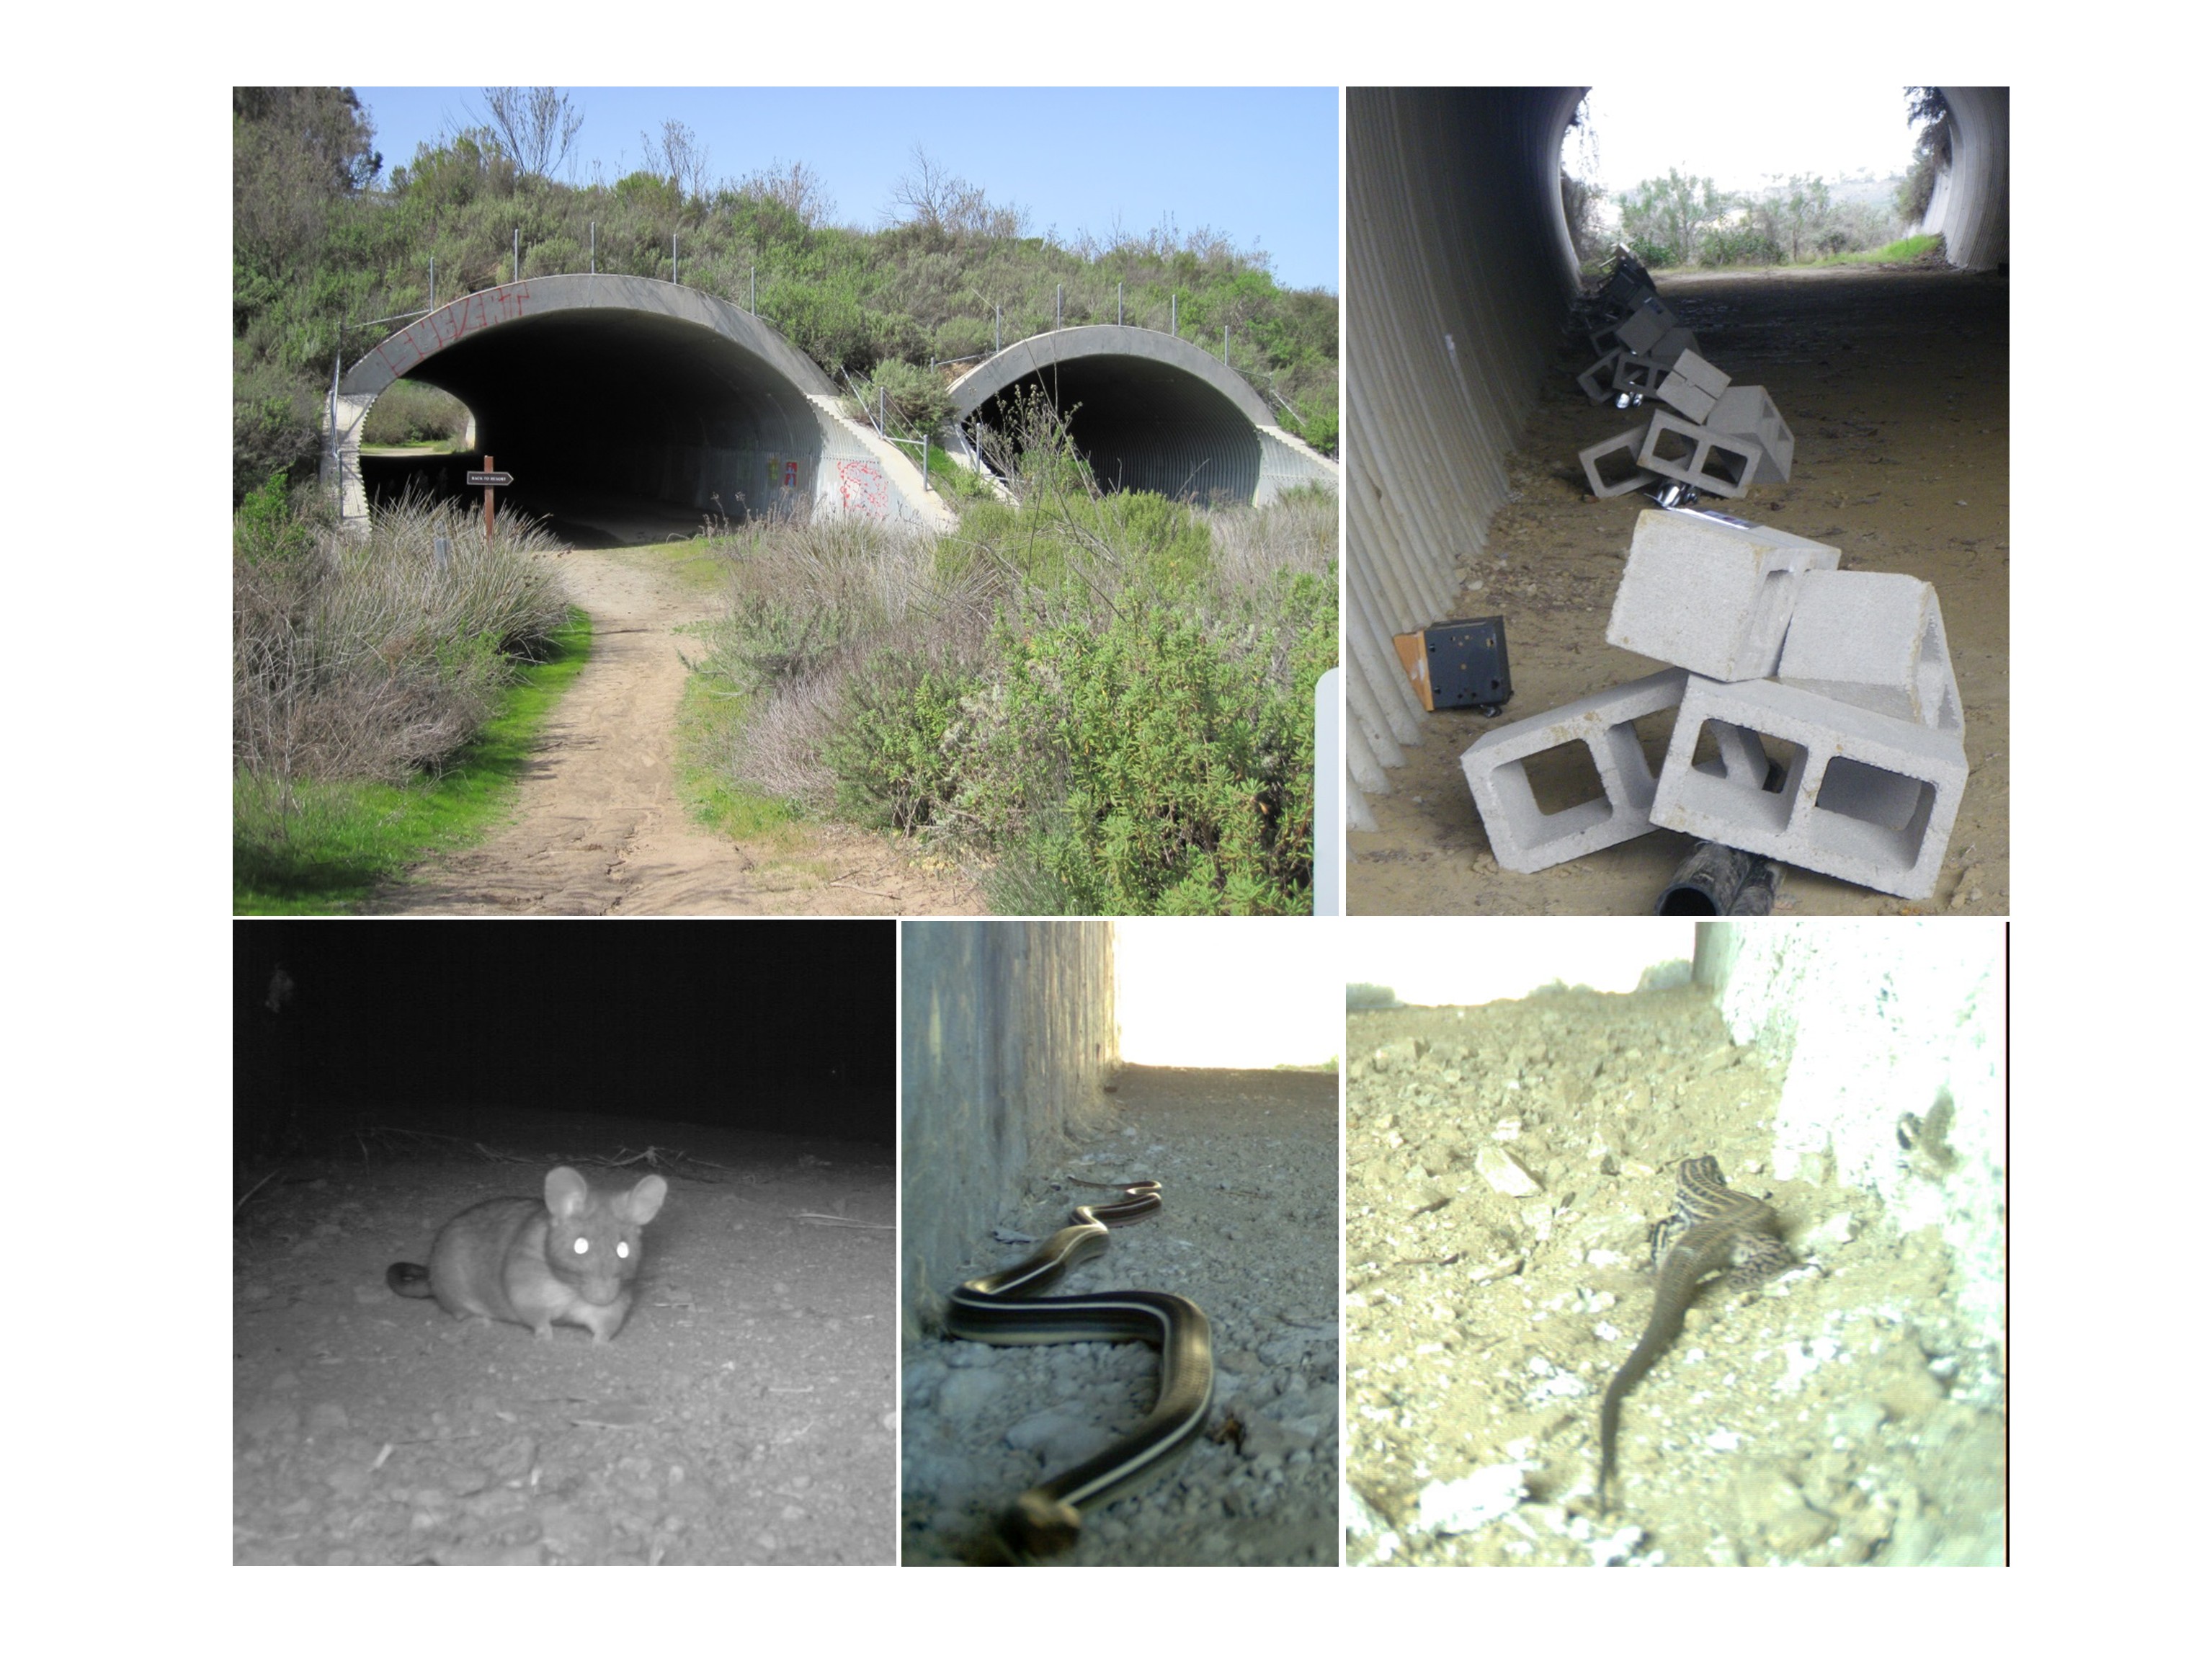
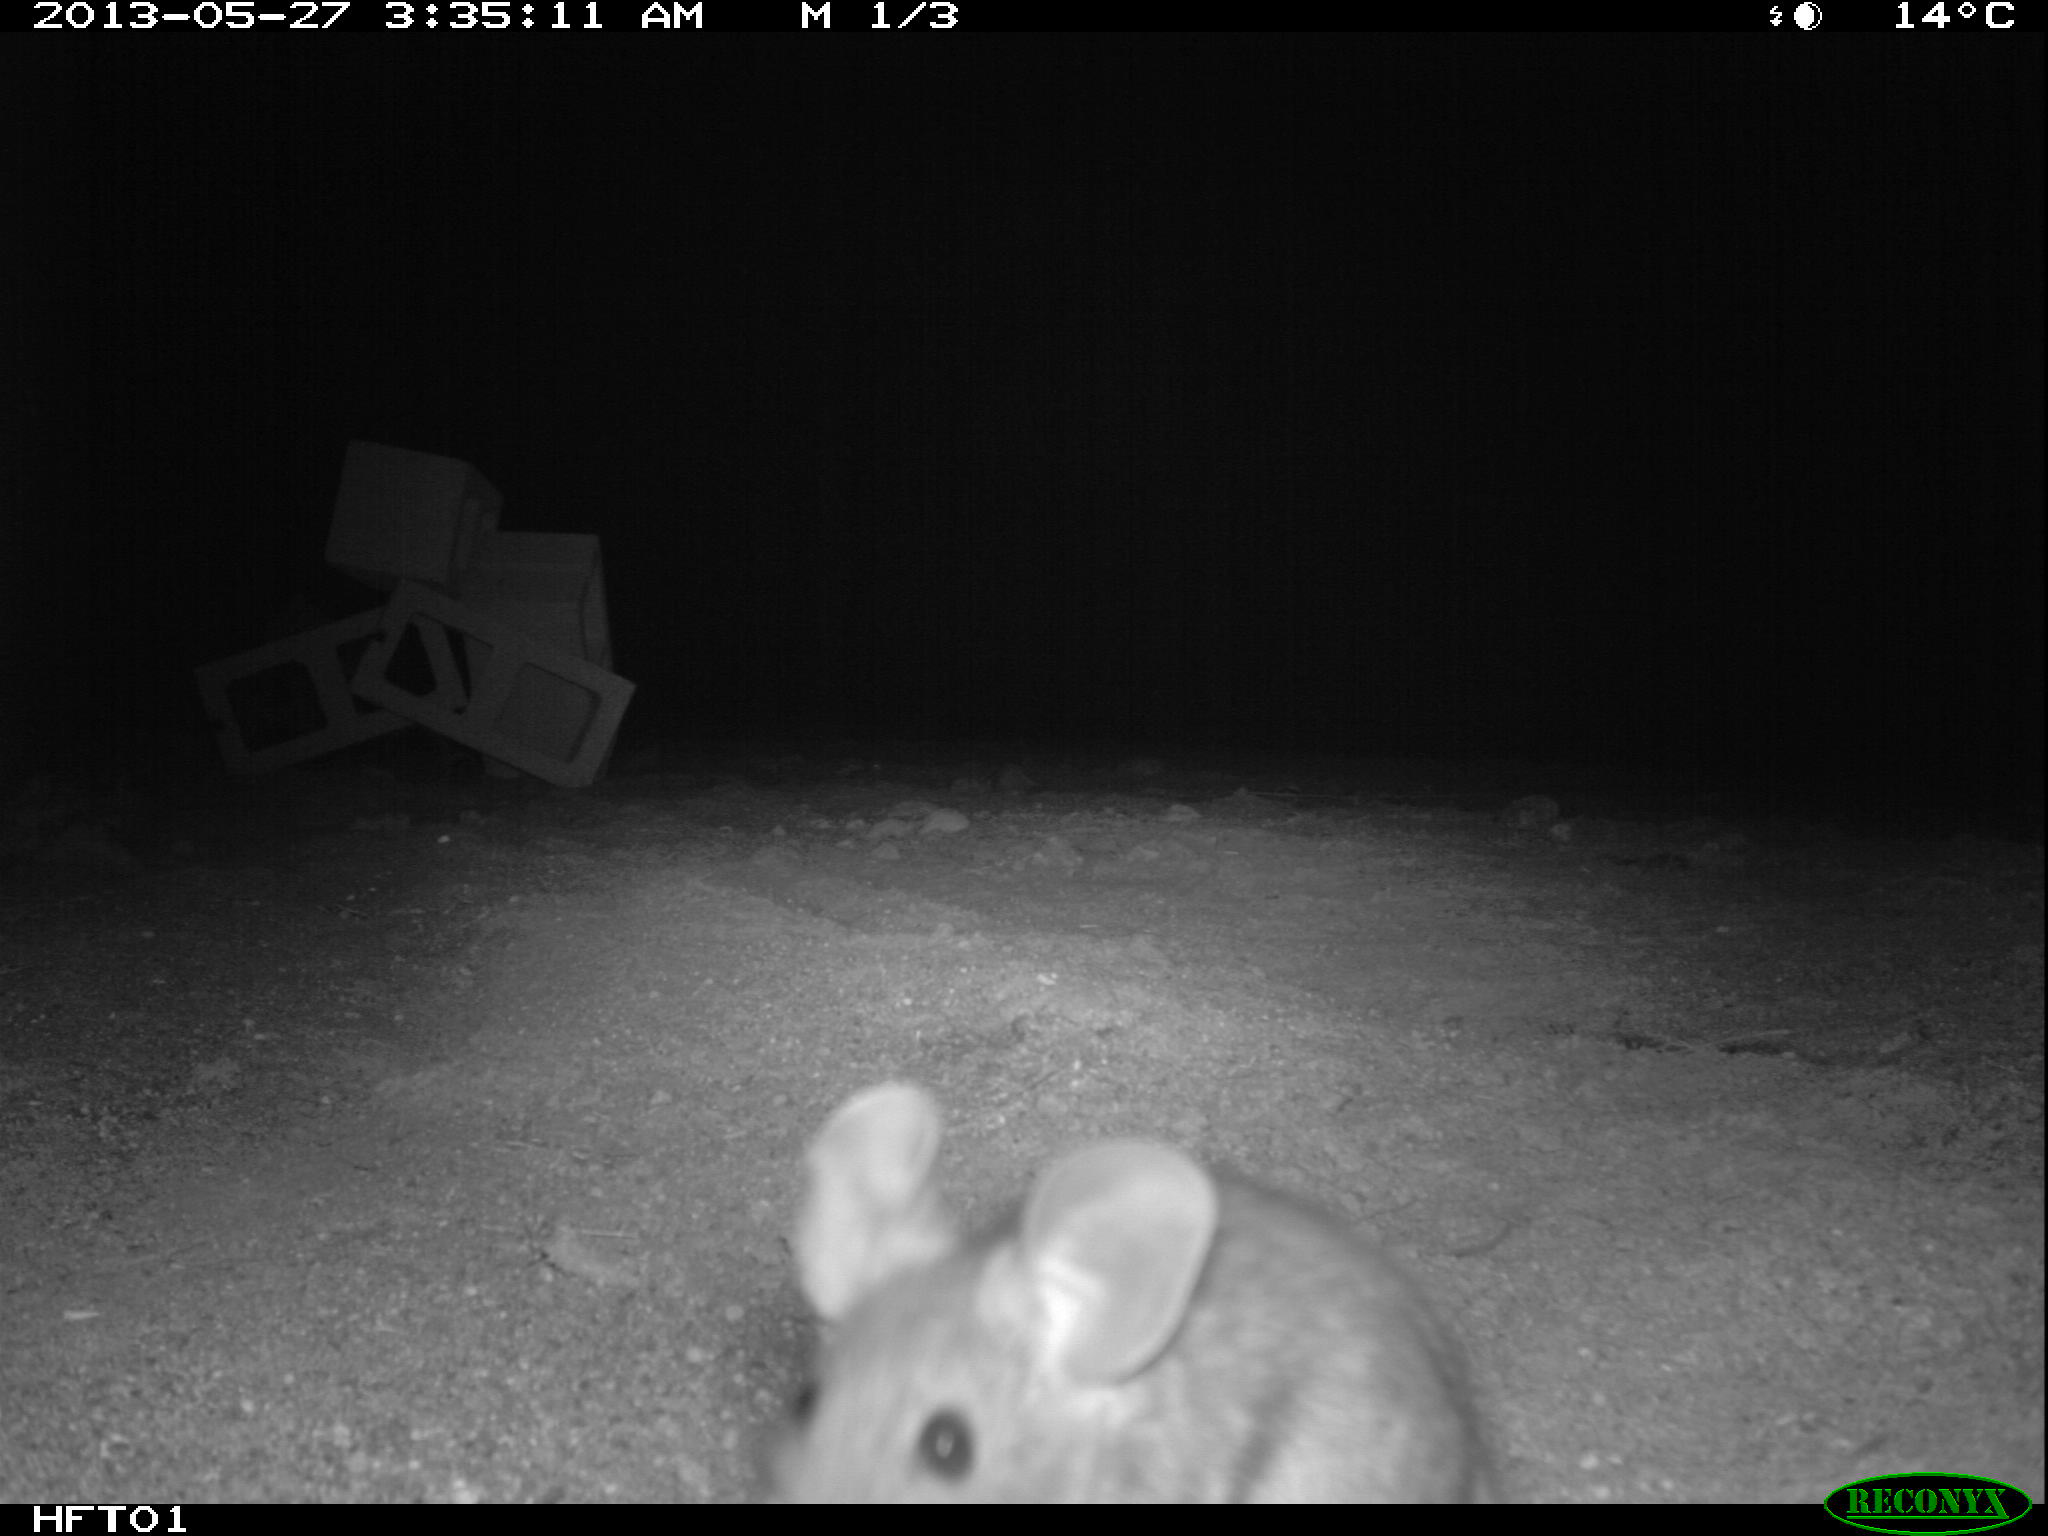
One design decision I made early proved important later: each camera was configured to capture both motion-triggered images and simultaneous time-lapse images at regular intervals. This gave us a continuous time series of background frames — useful for detecting animals with low infrared signatures that might not reliably trigger the motion sensor, and essential as background reference images for computer vision work that came later.
The result was over 3.1 million images from two field seasons.
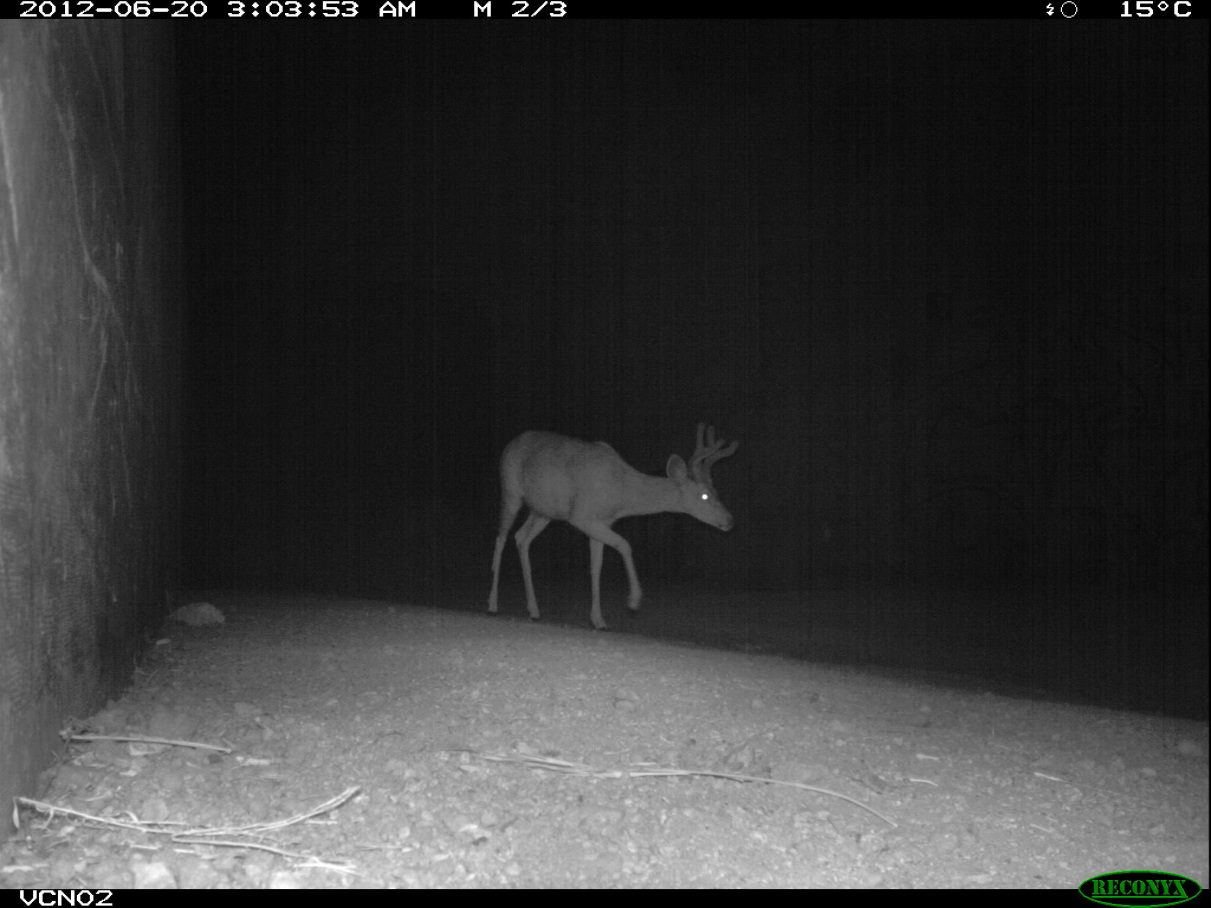
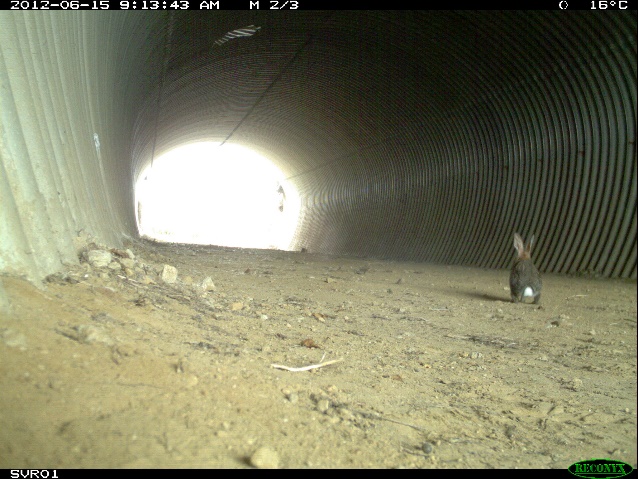
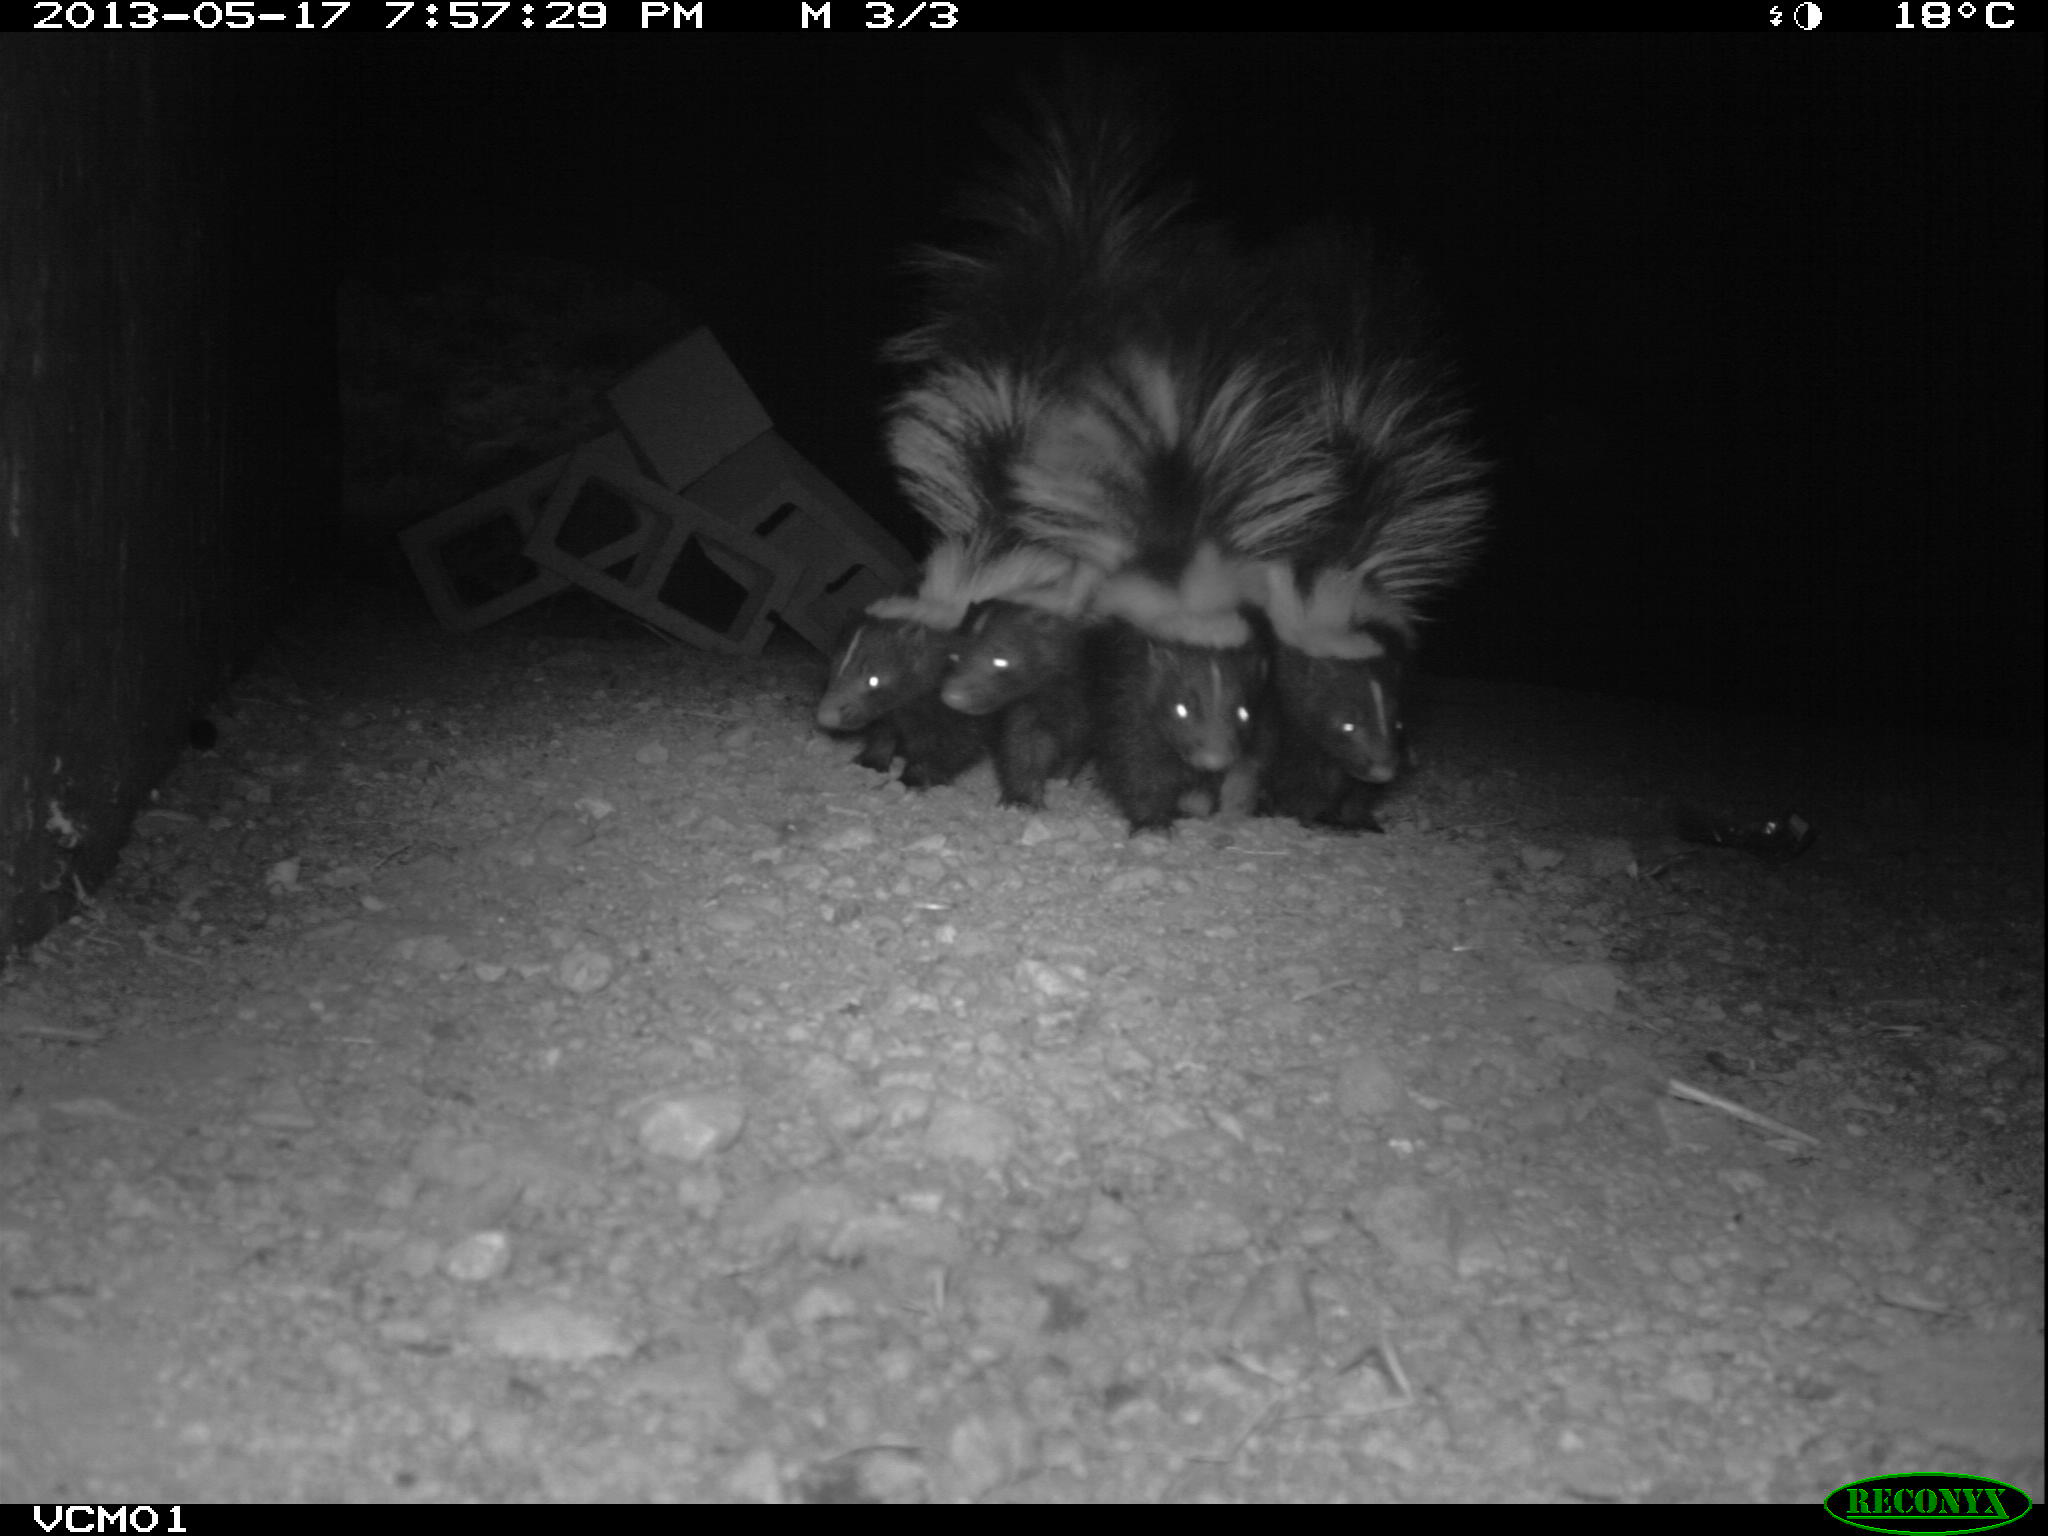
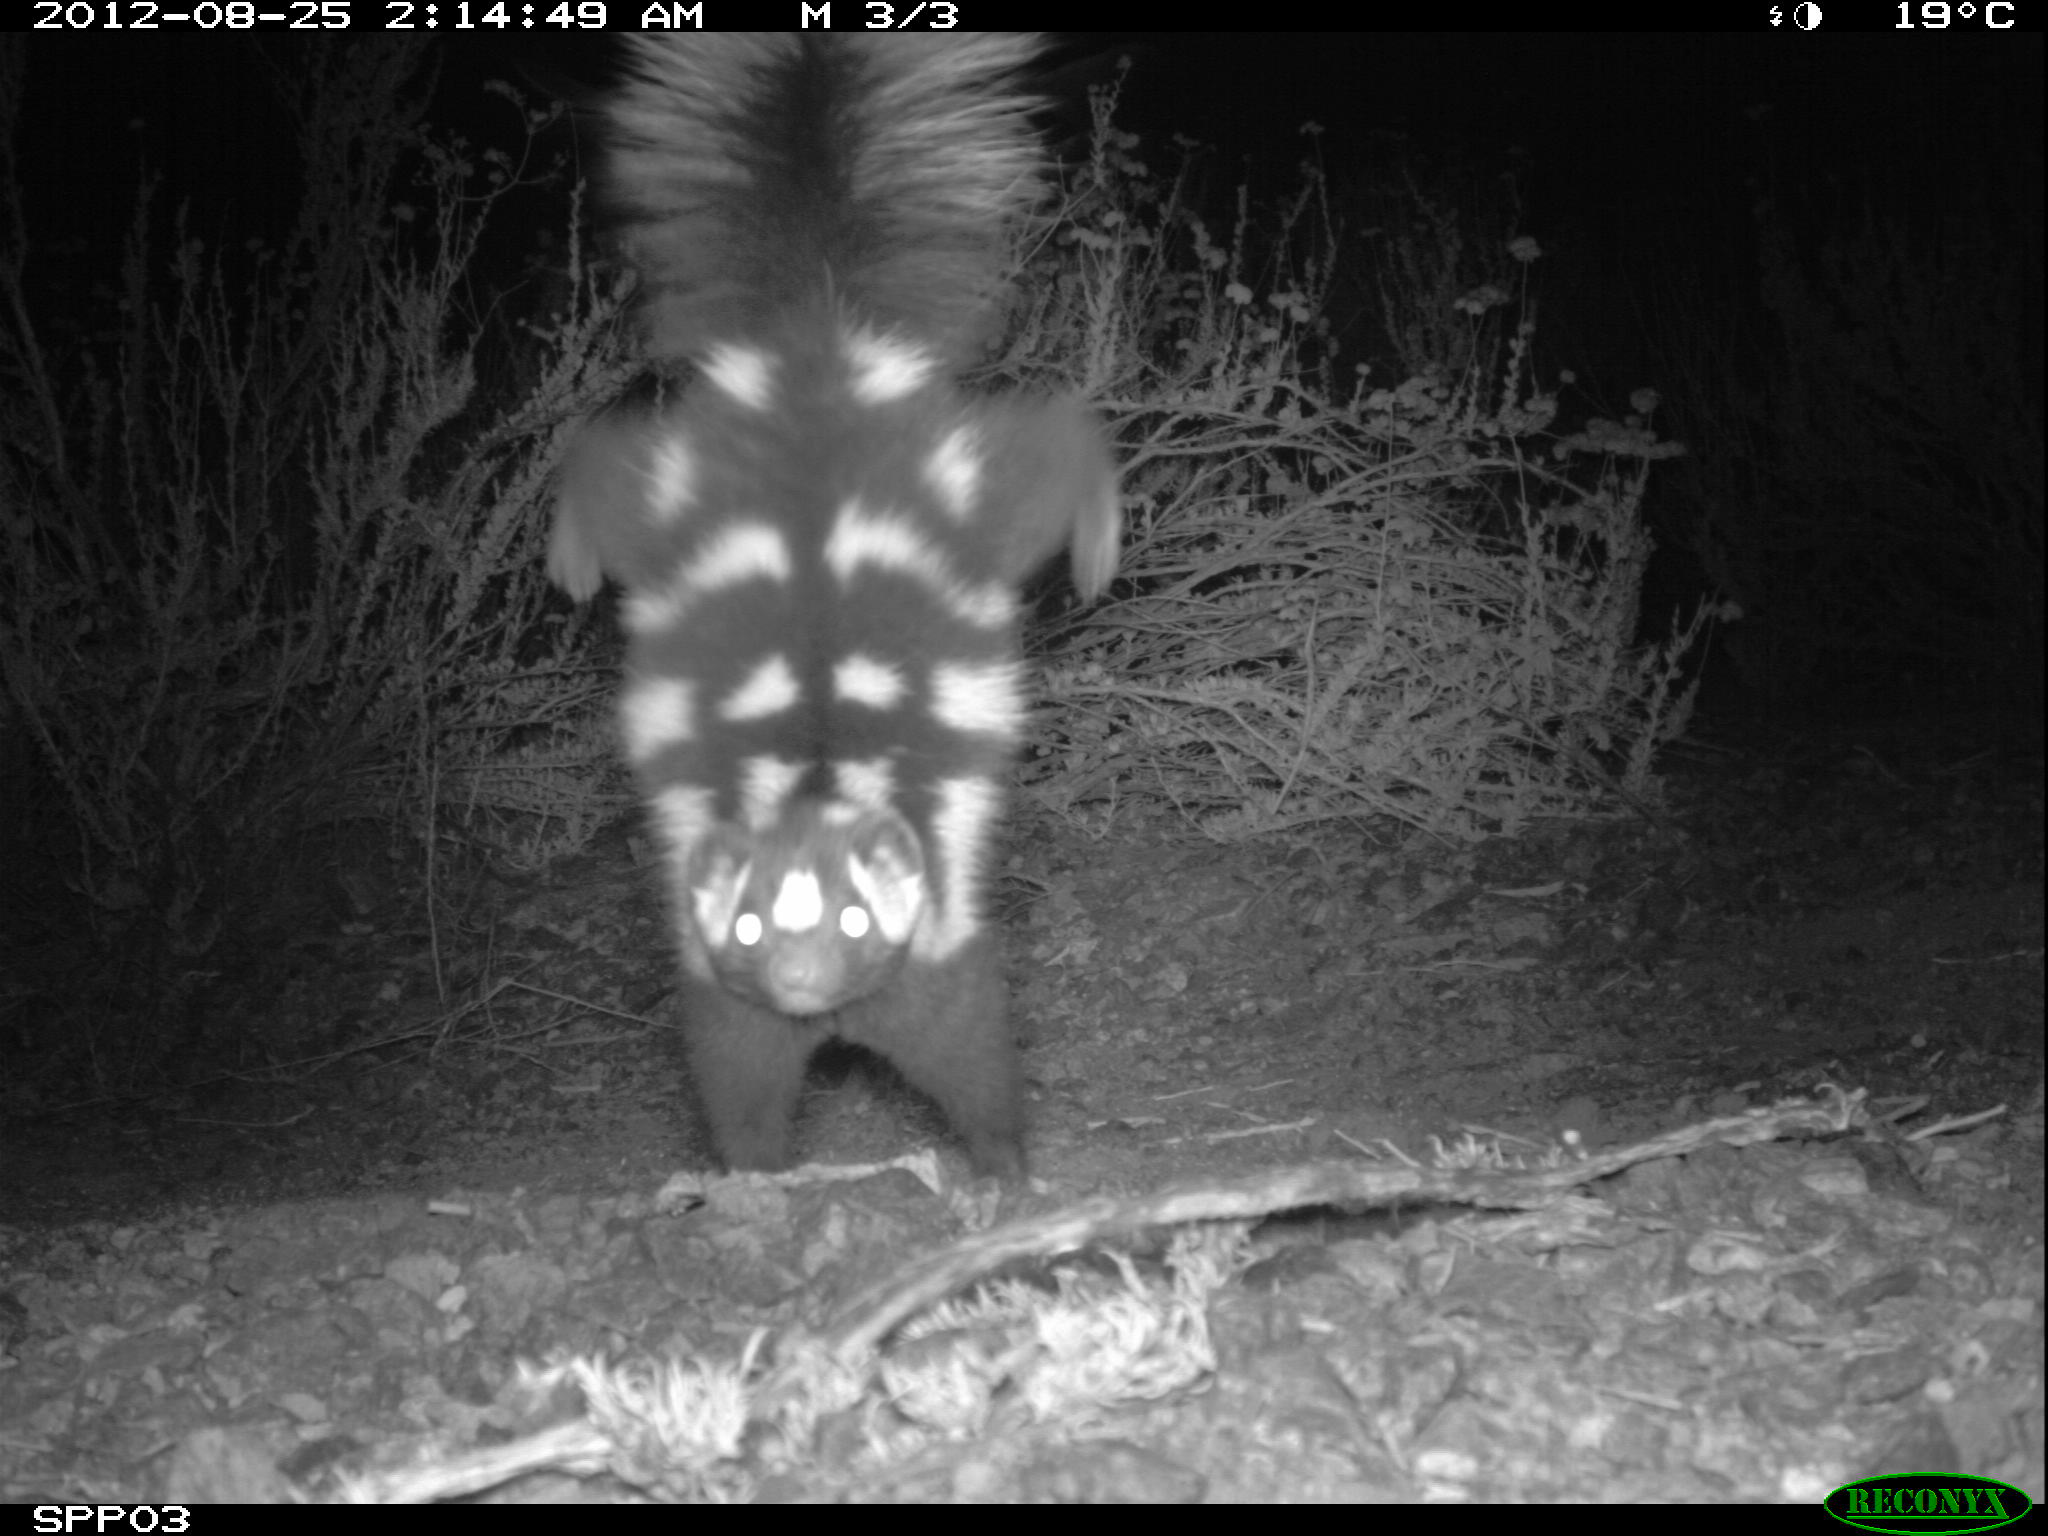
What the Cameras Found
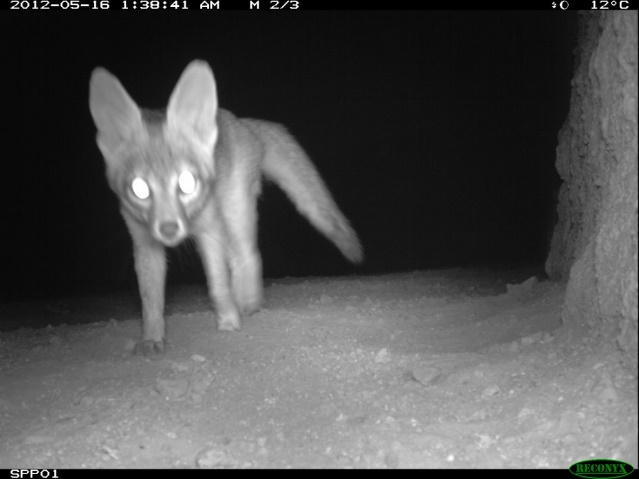
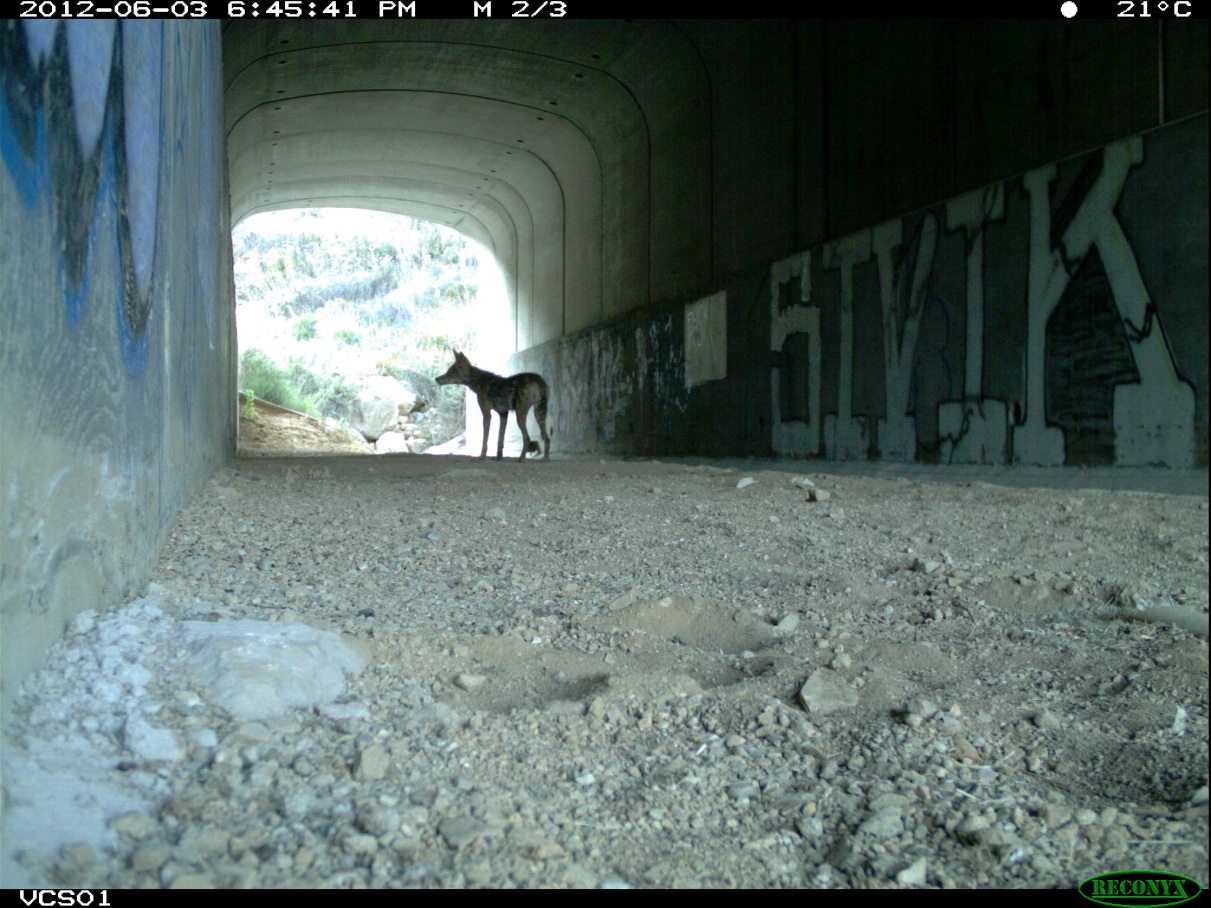
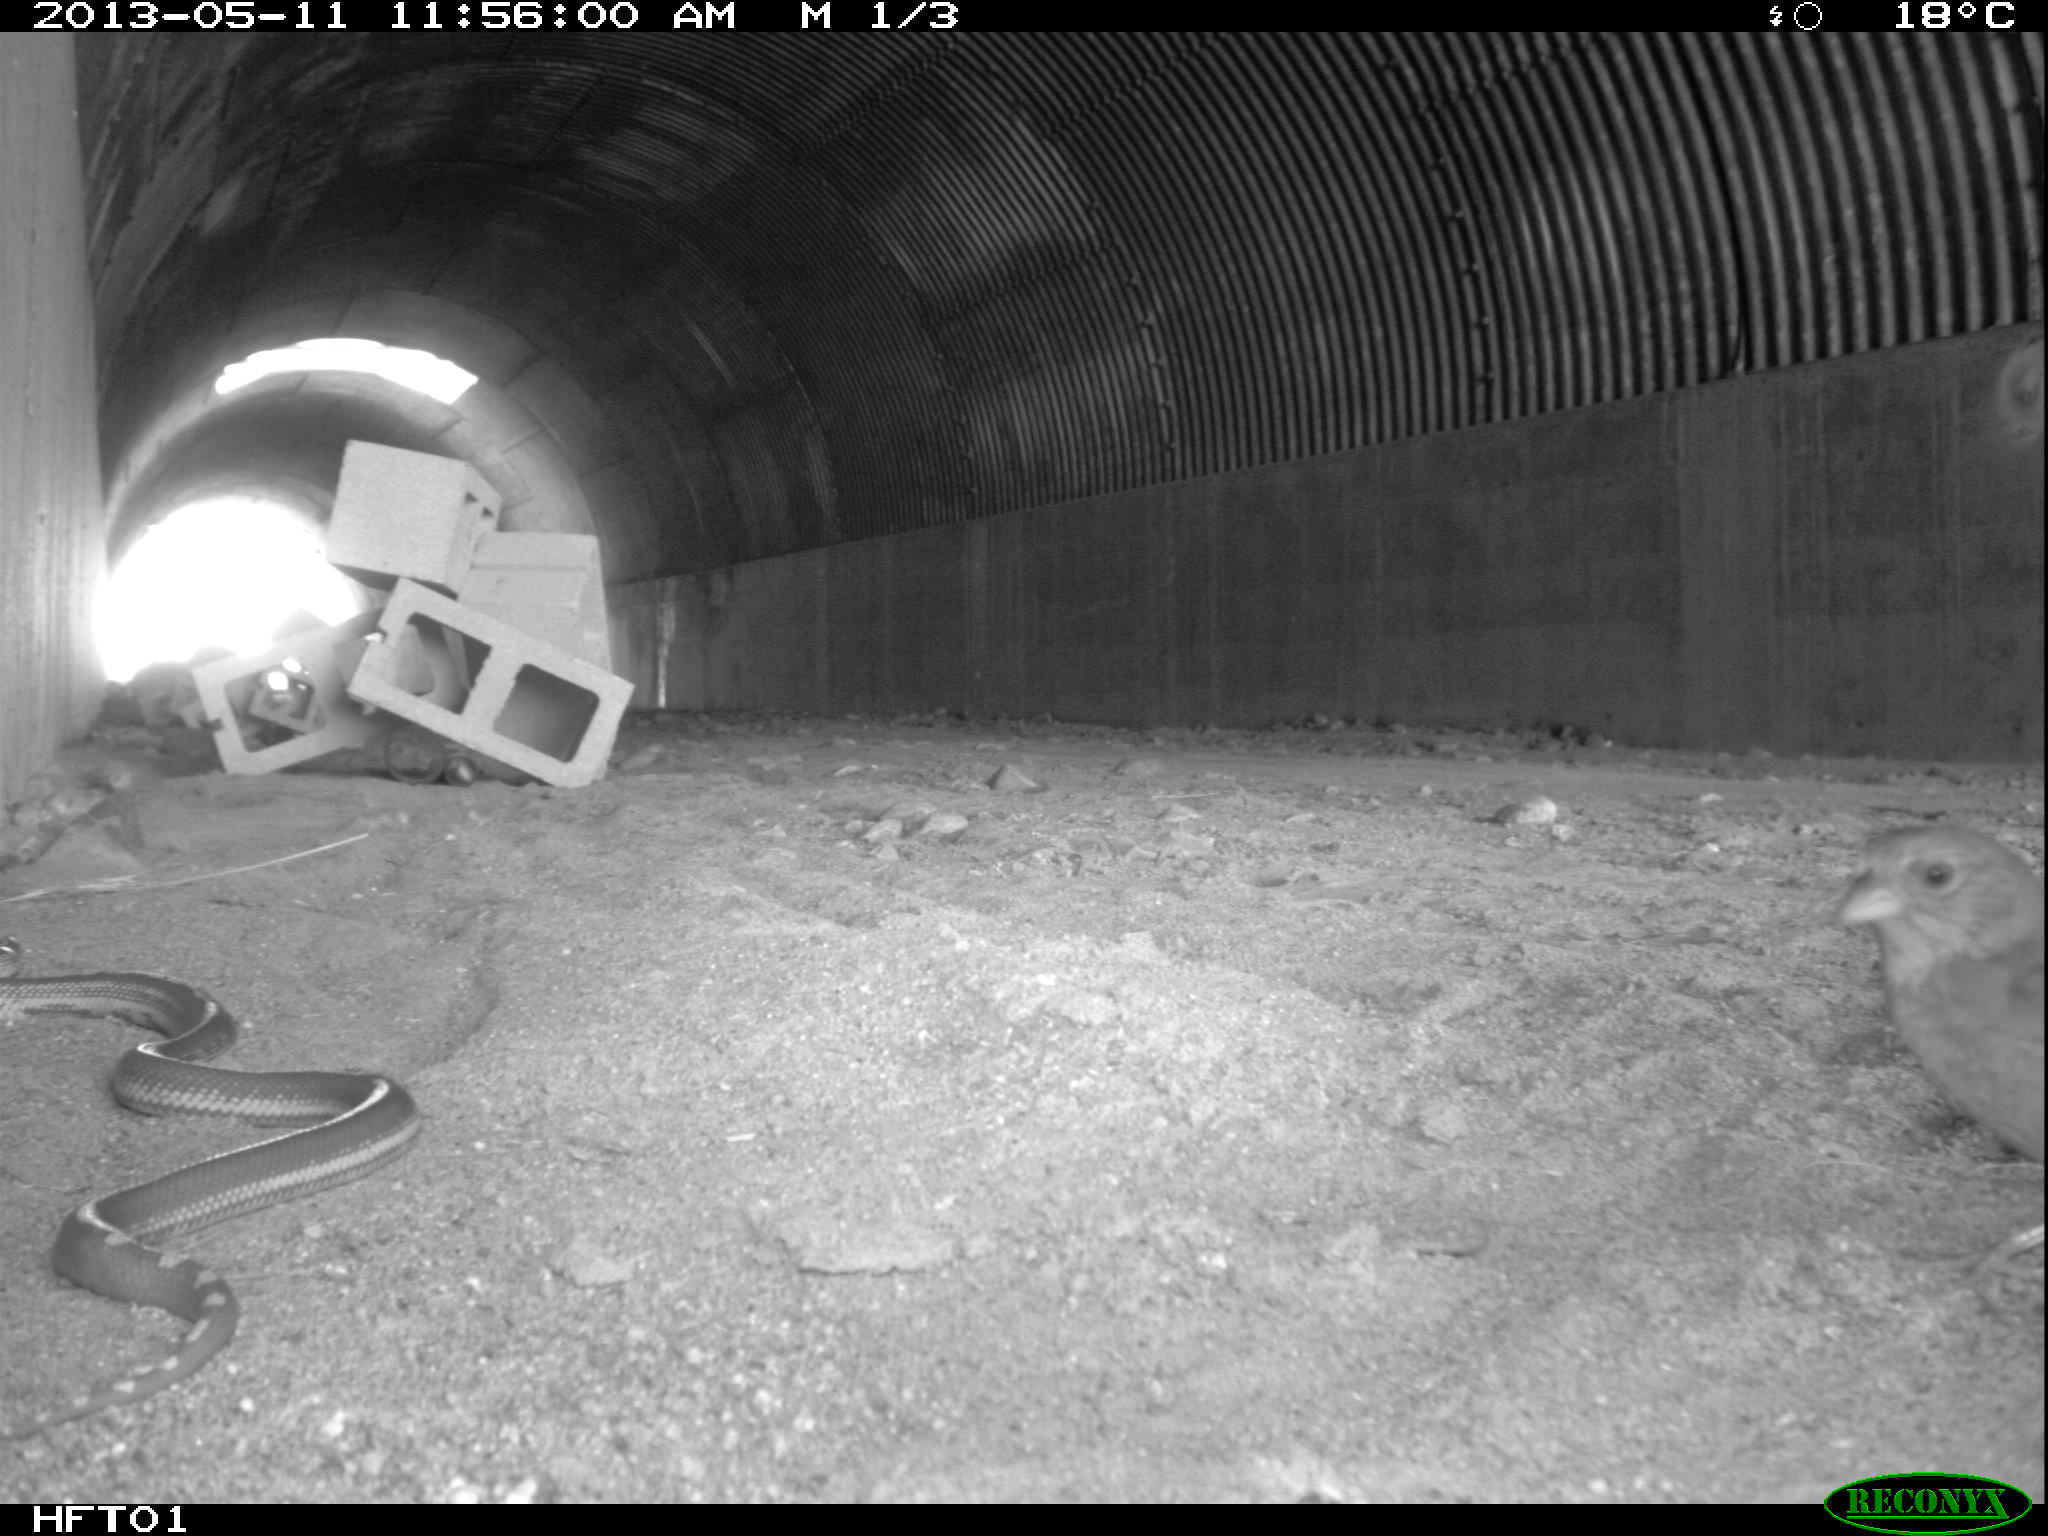
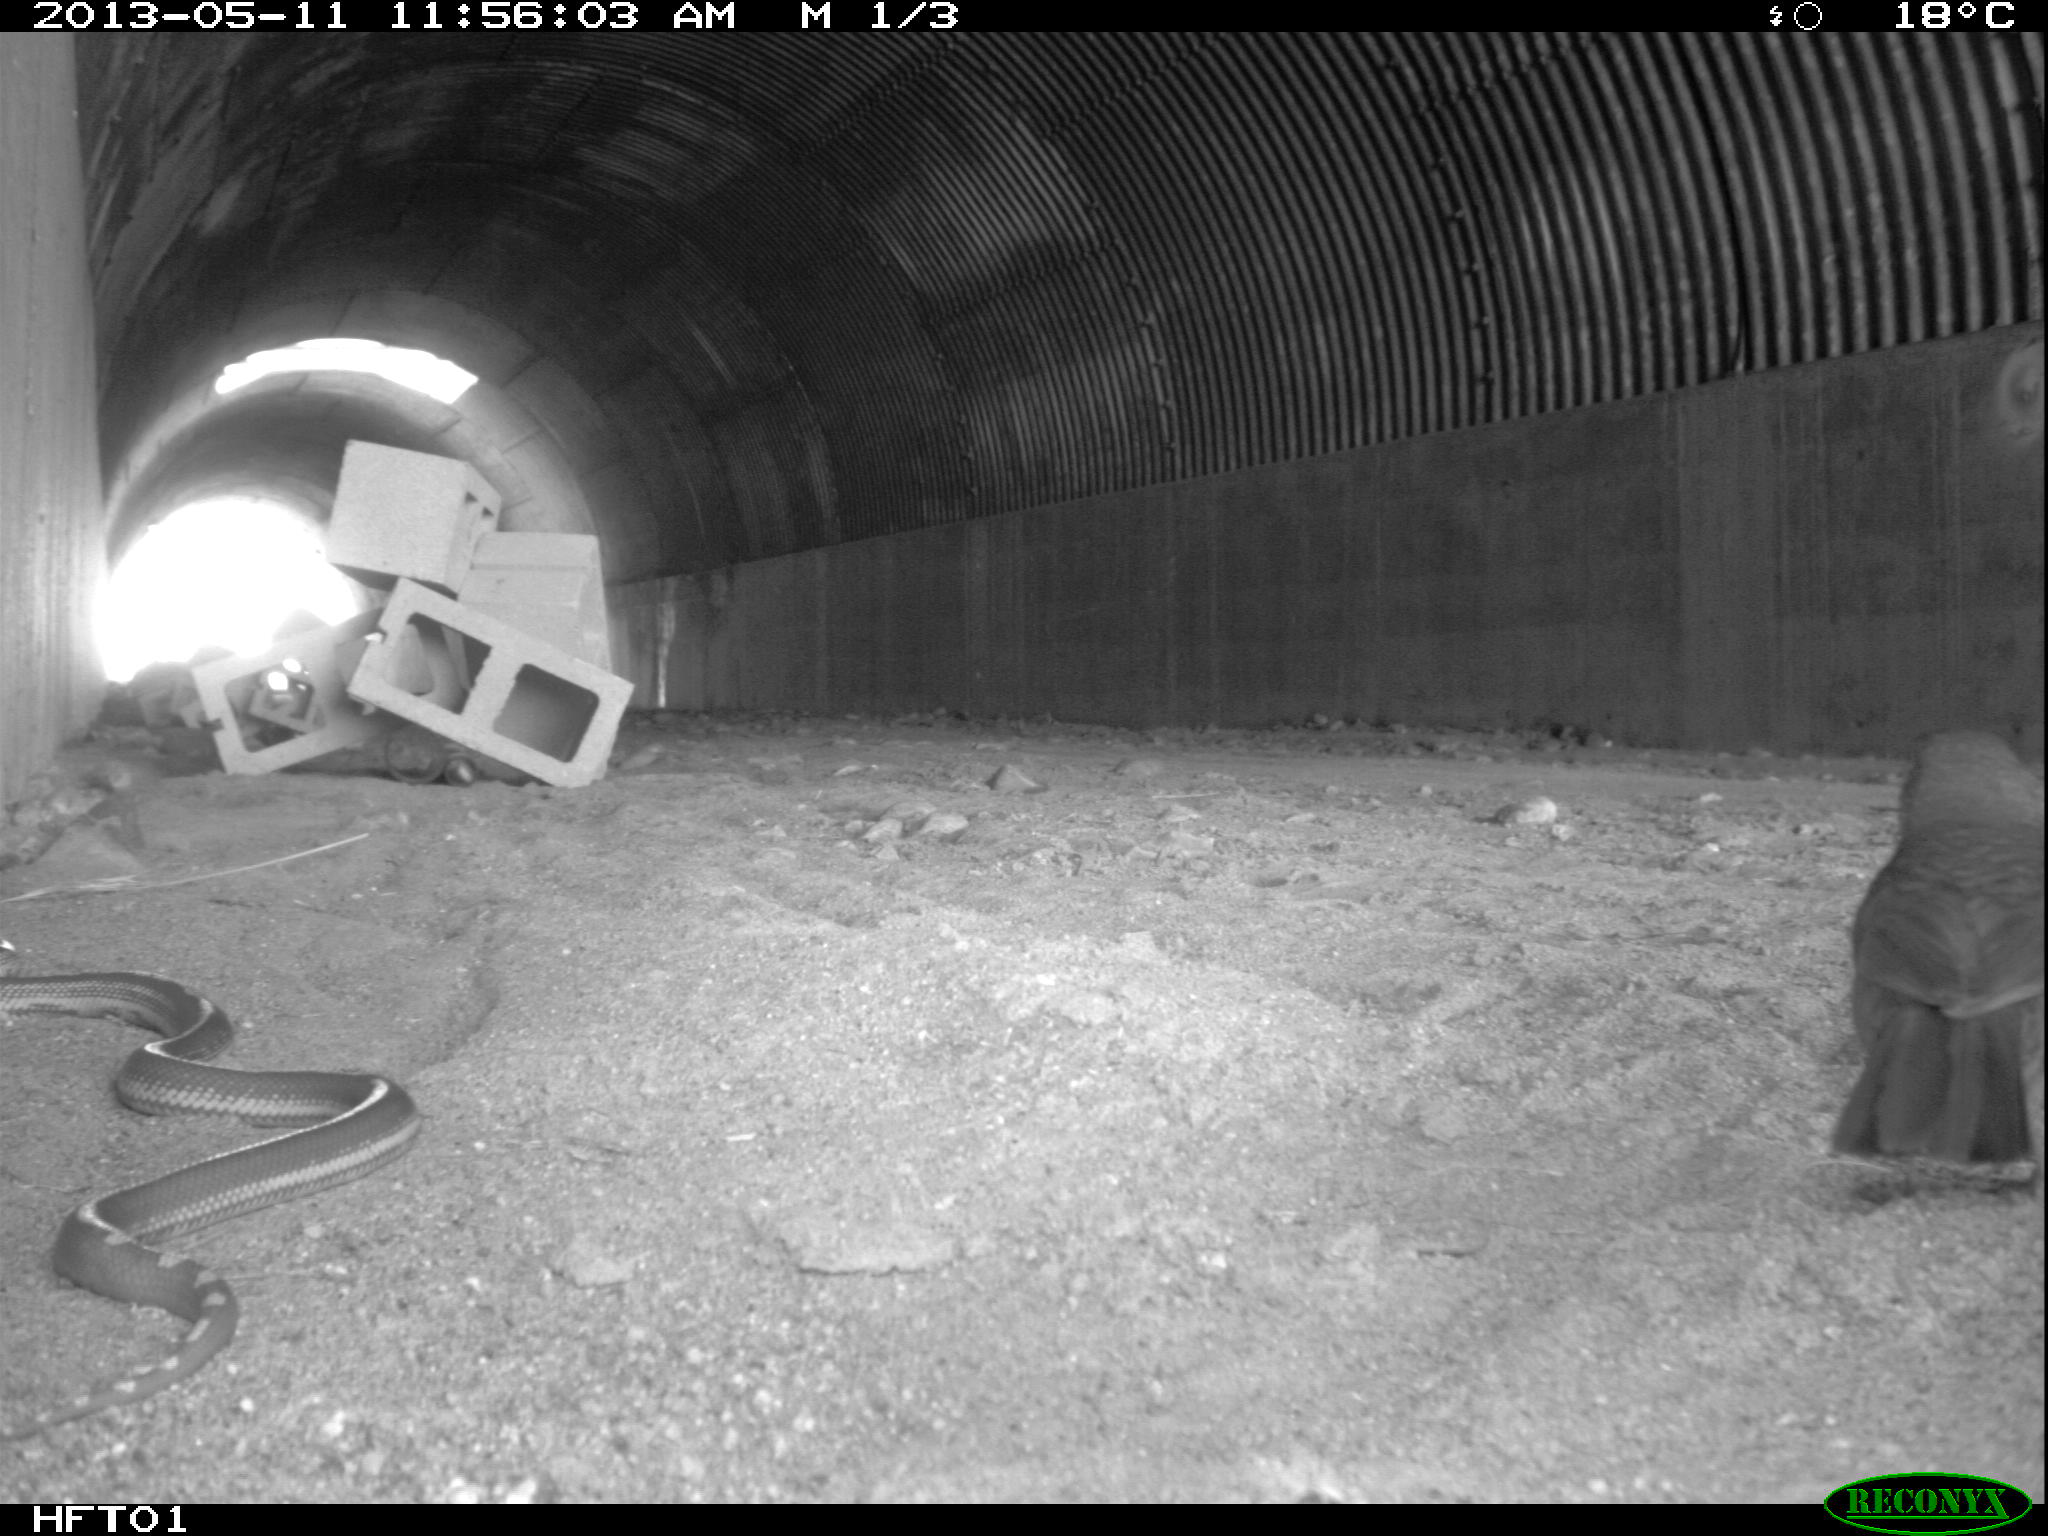
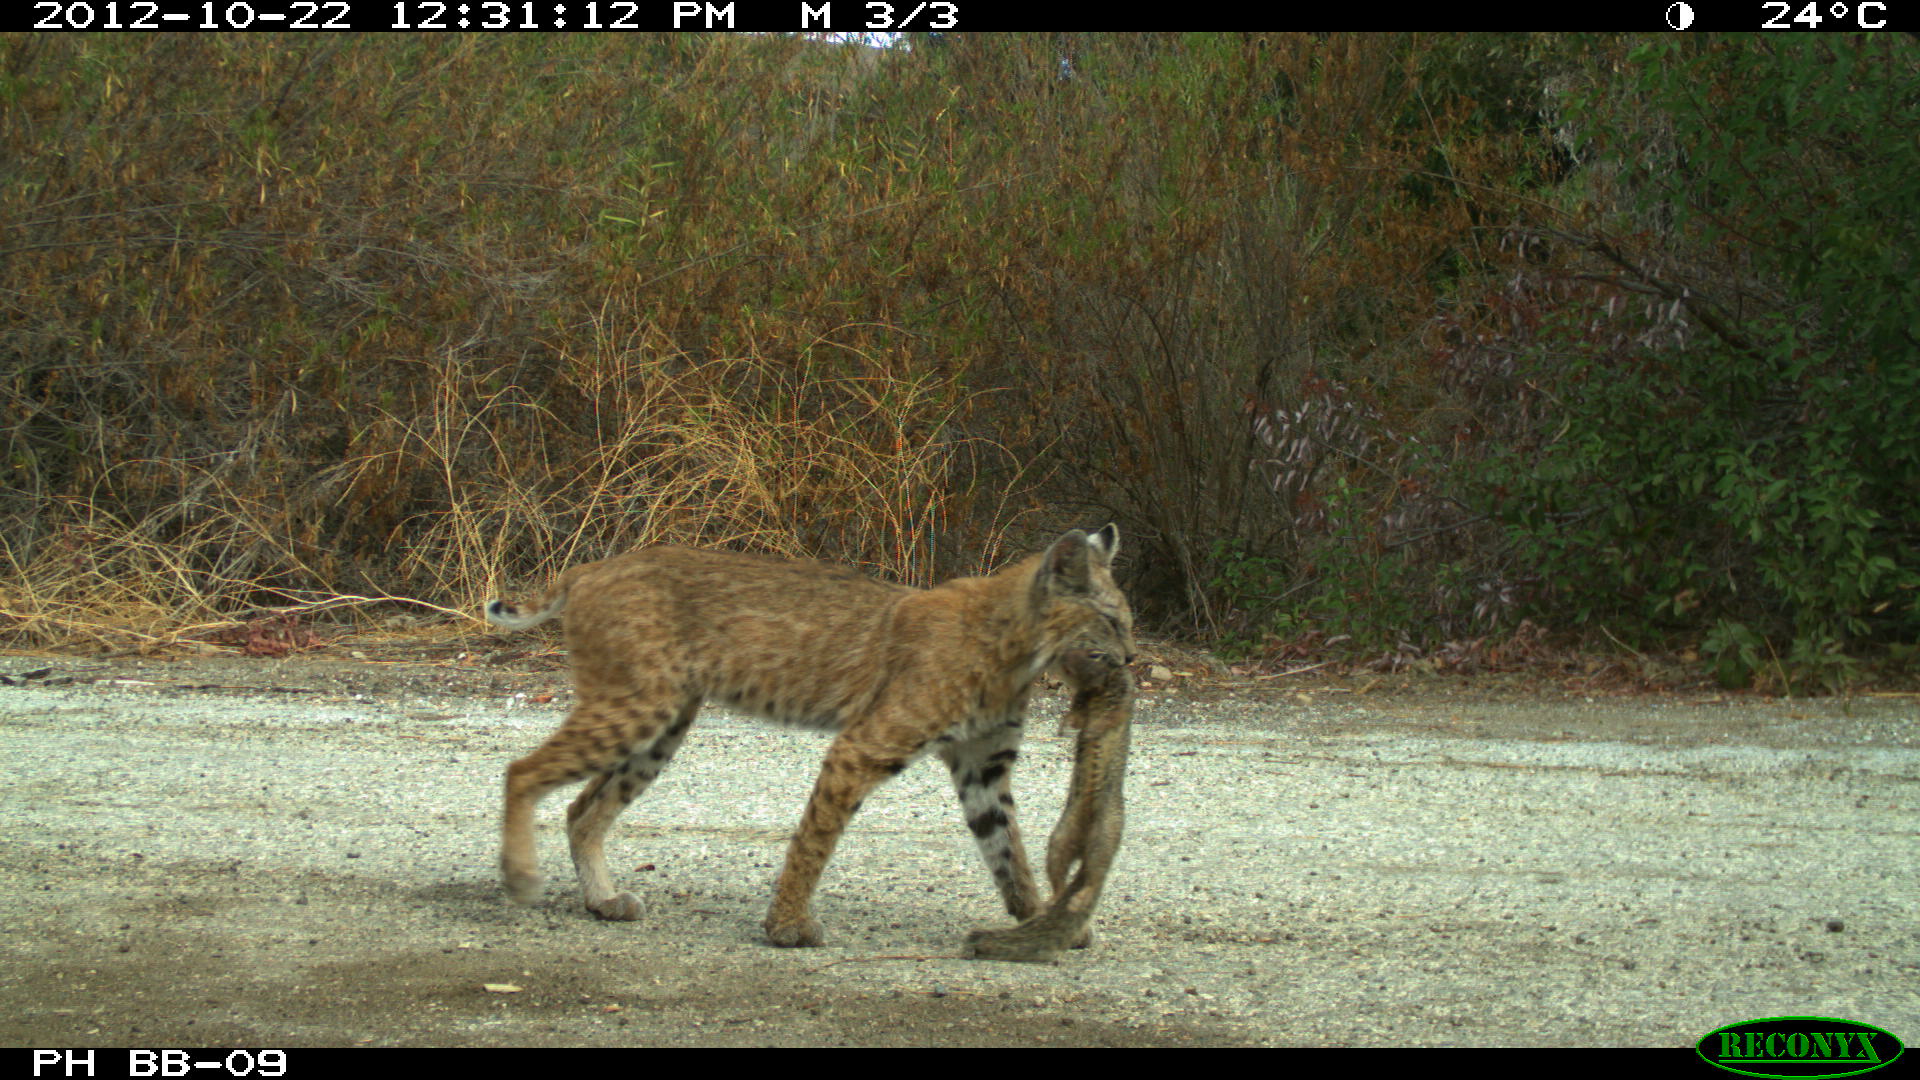
The underpasses were used by a remarkably diverse community of vertebrates — from mule deer and bobcats to roadrunners, lizards, and snakes. Most crossings happened at night. Coyotes were frequent and confident. Bobcats were more cautious. Rabbits used the corrugated metal culverts regularly. Gray fox appeared at some sites but not others.

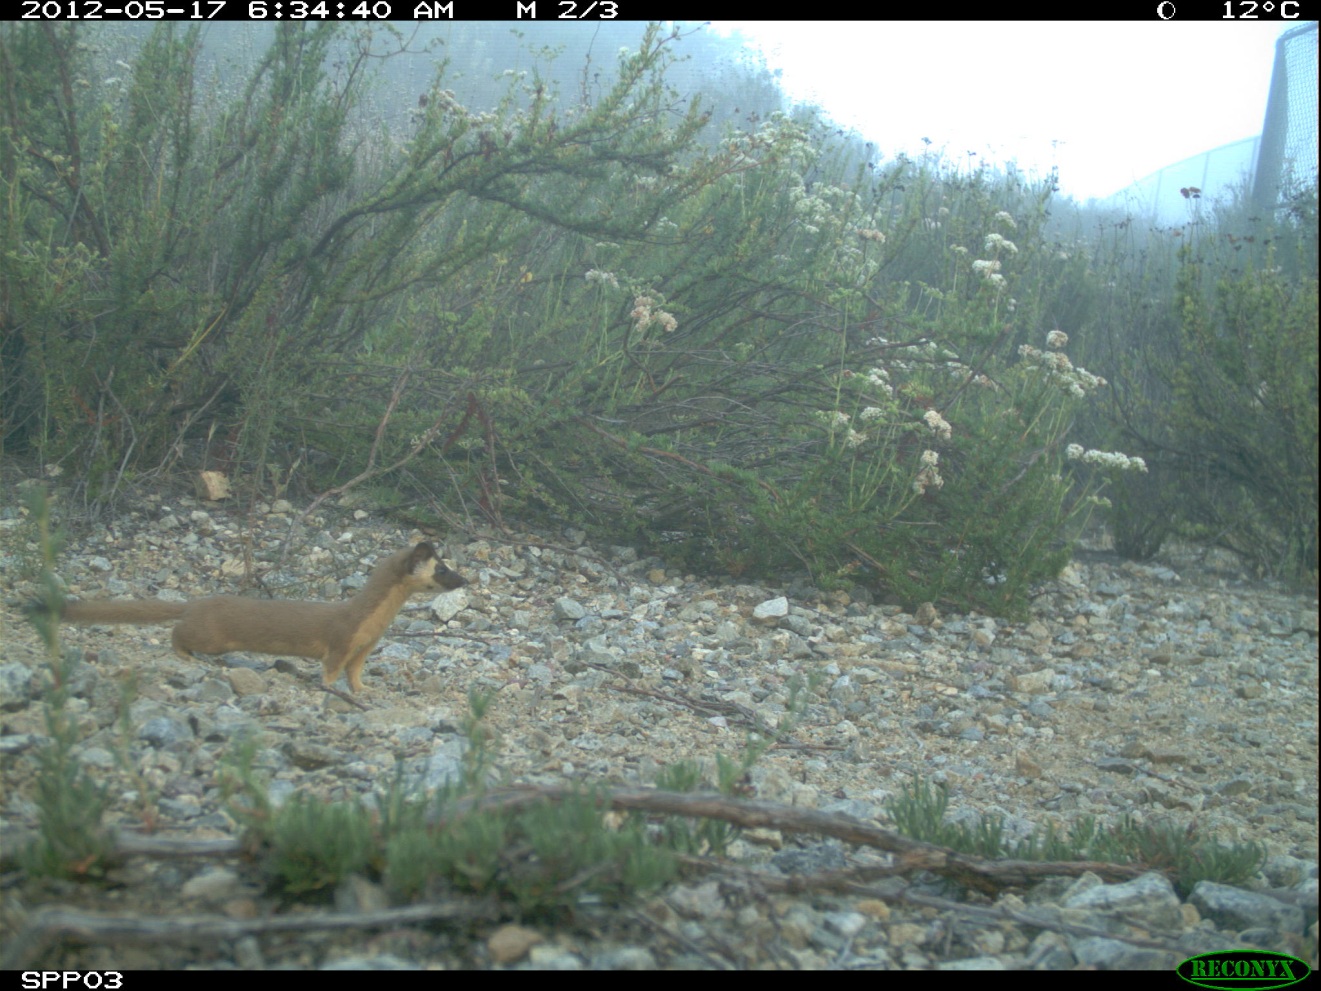
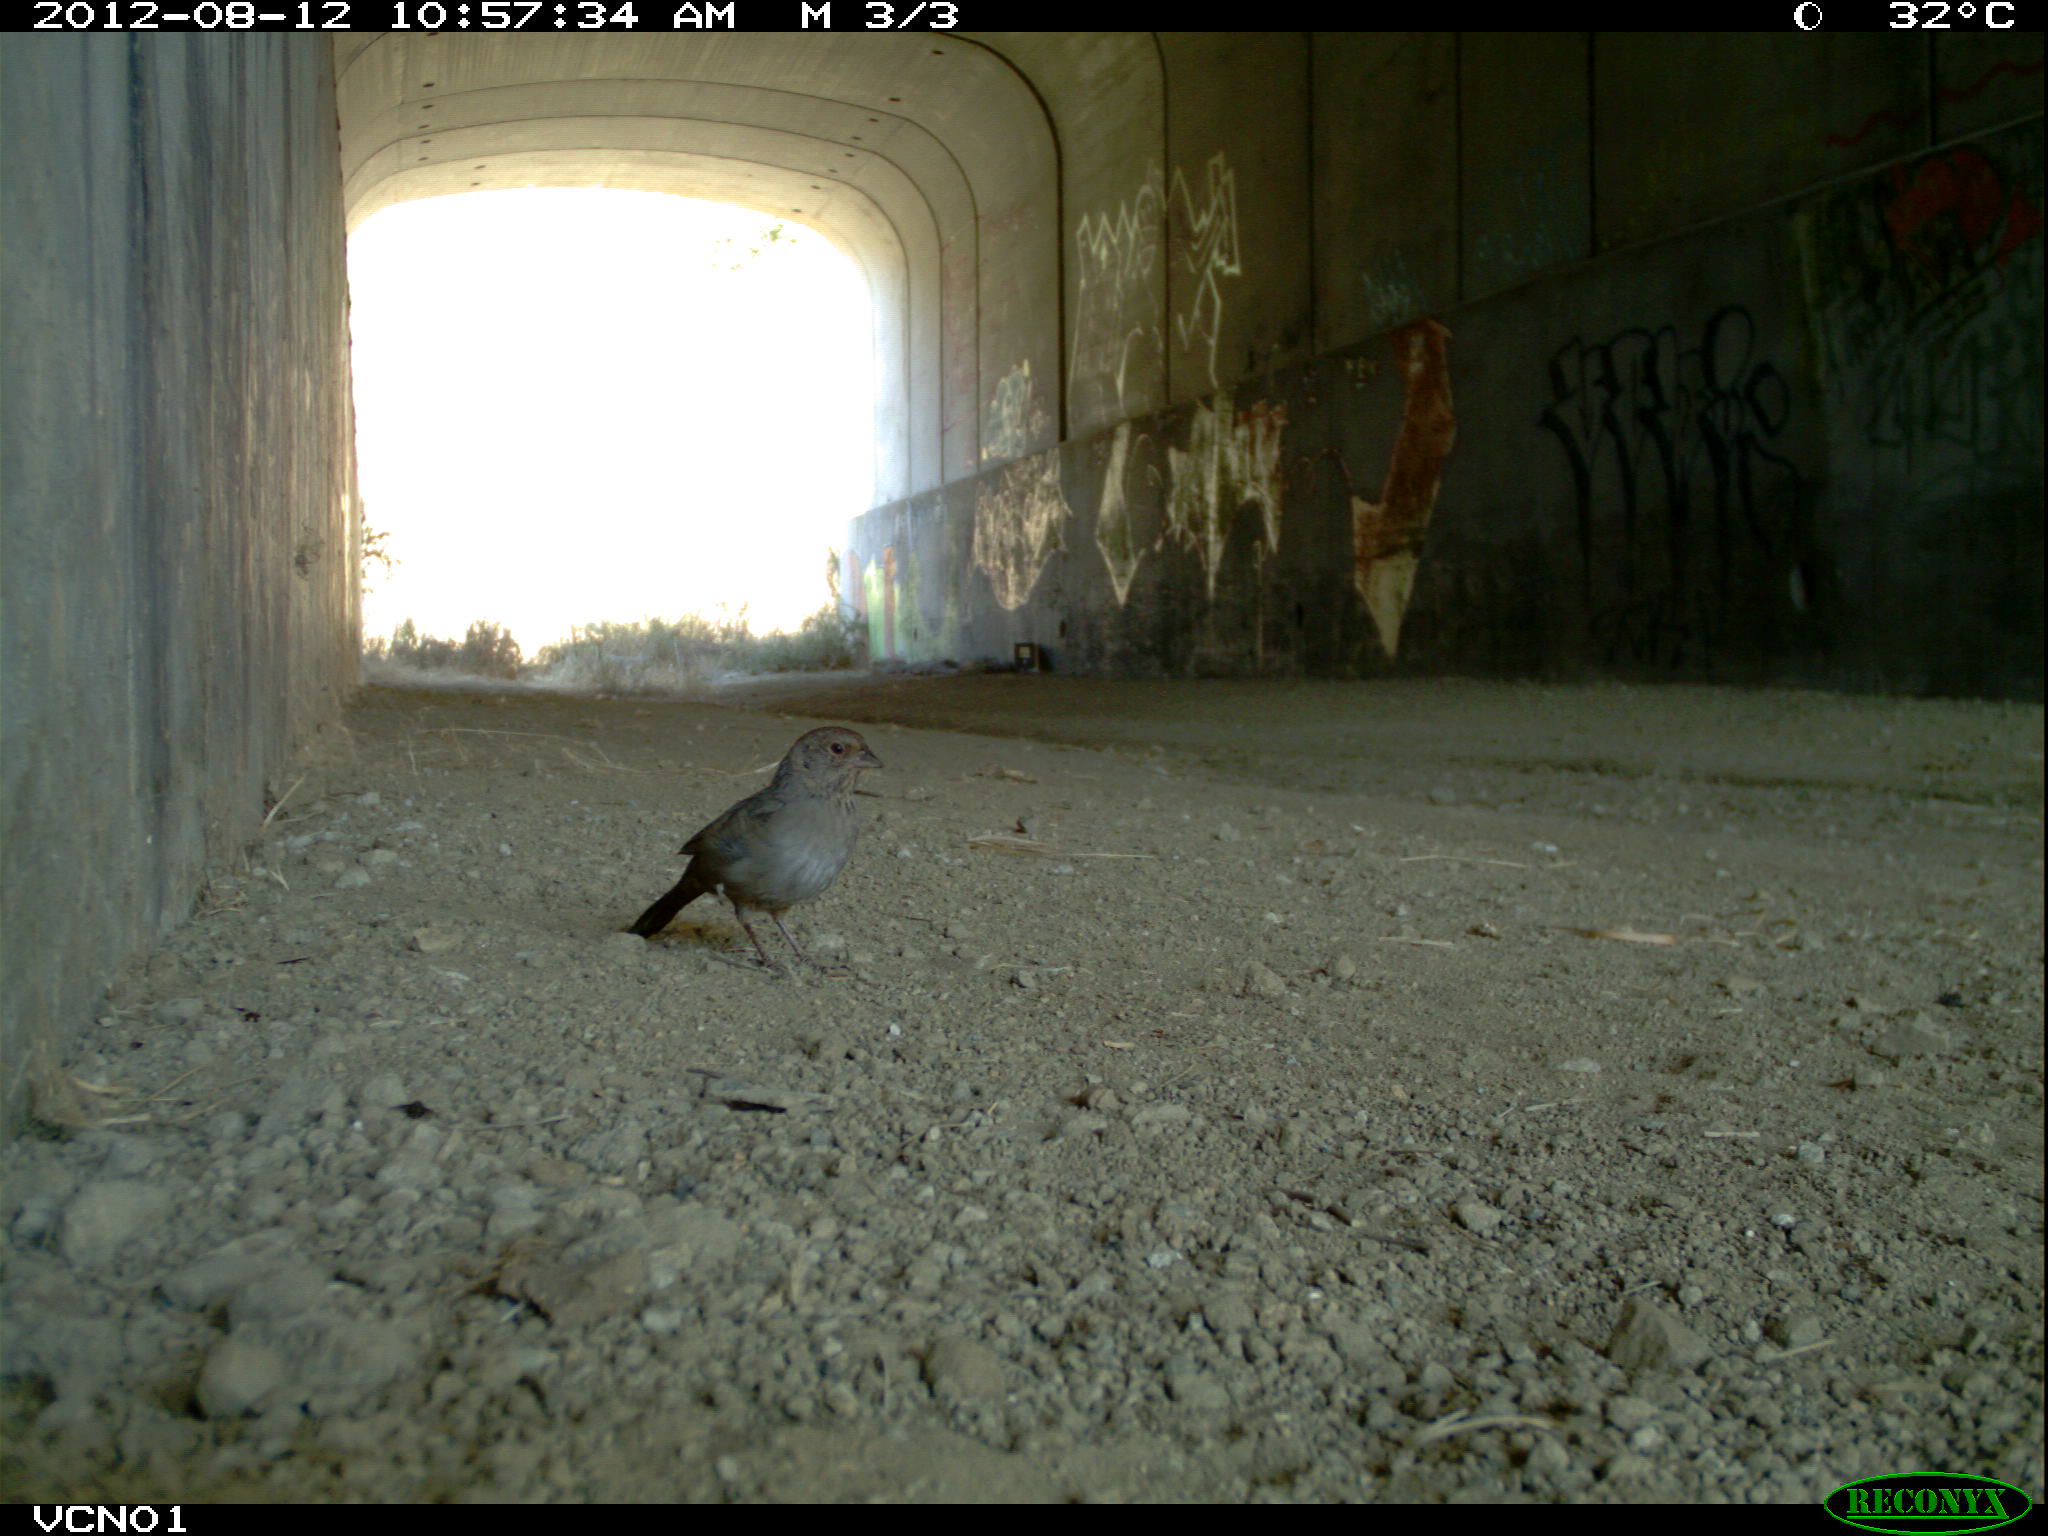
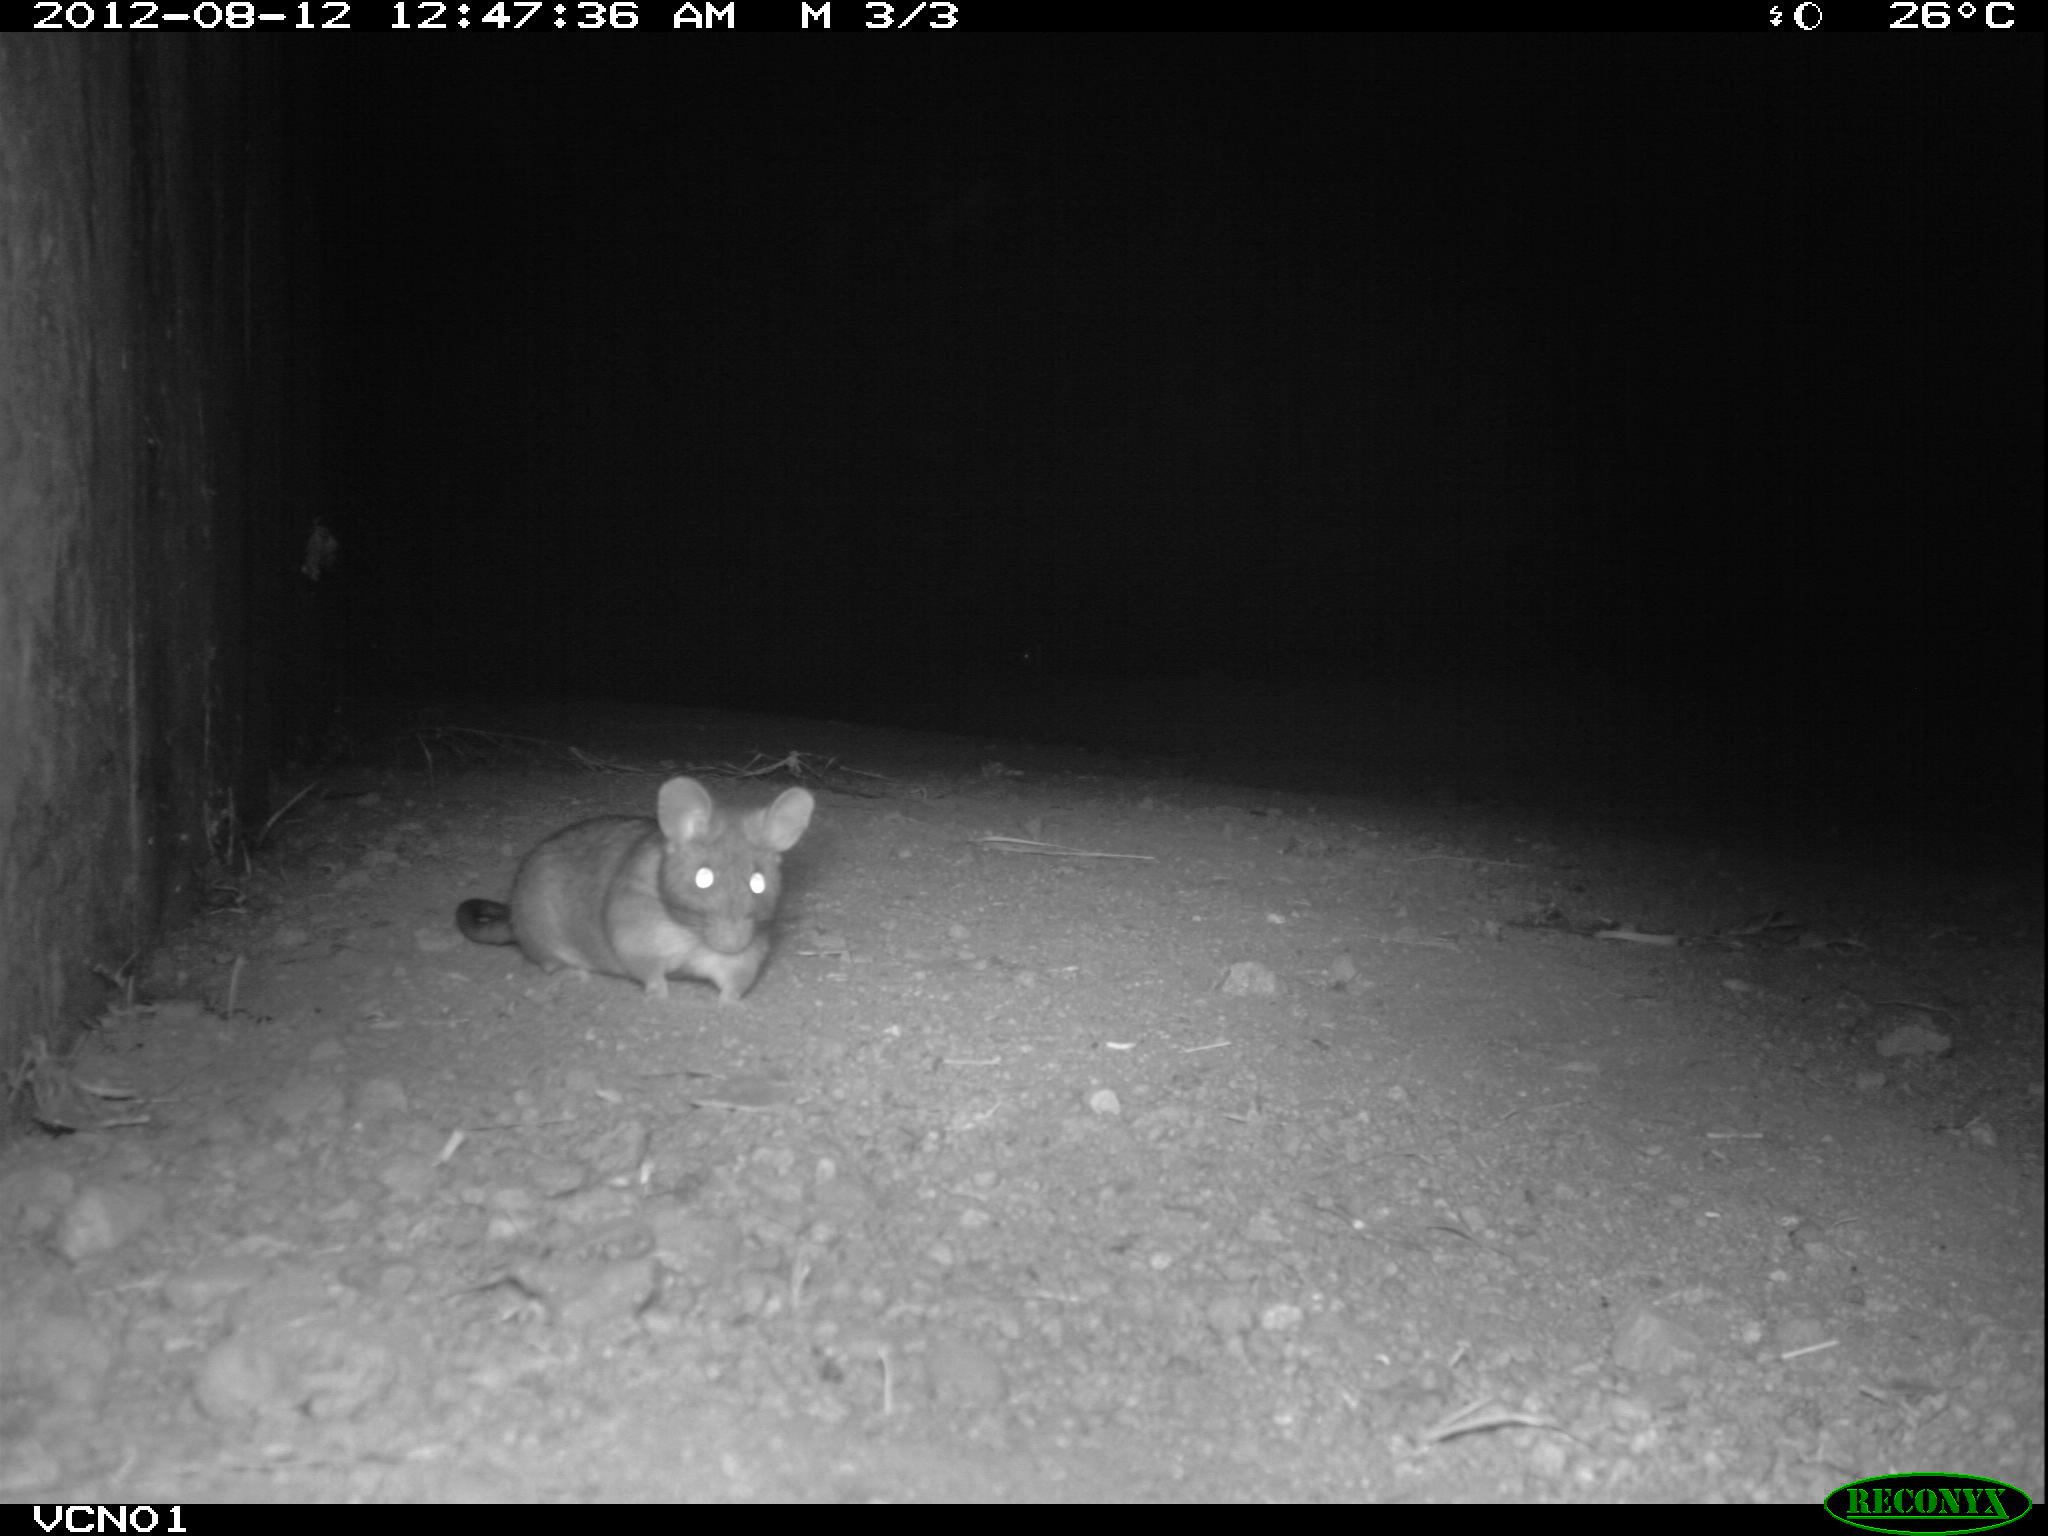
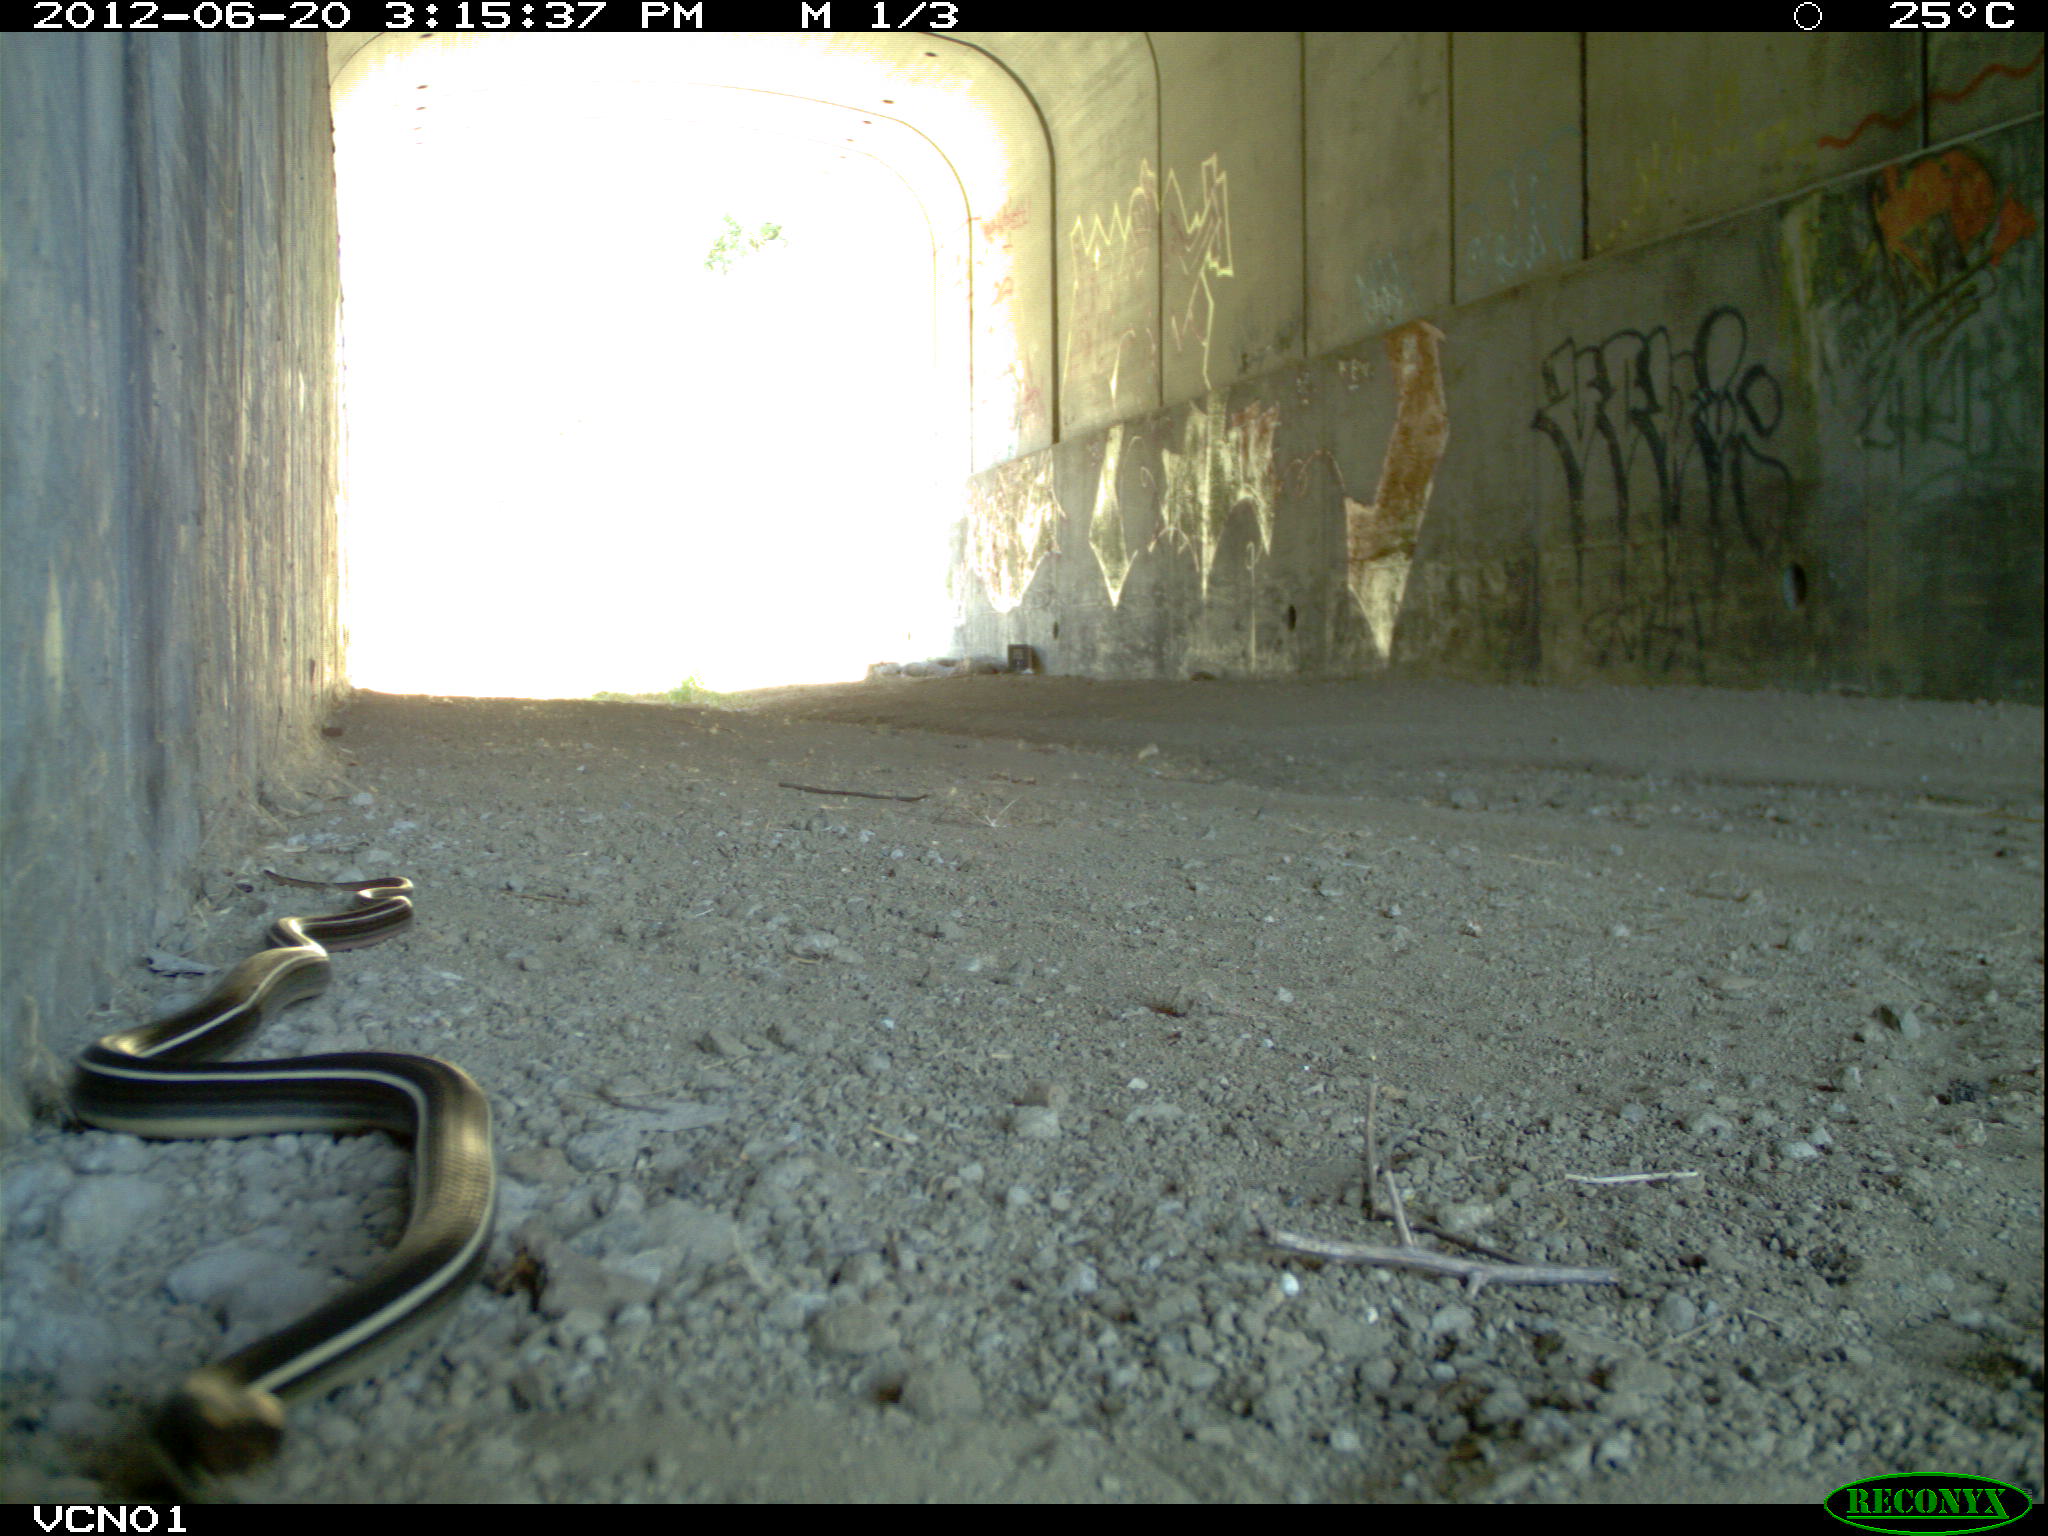
The diversity of species using the structures was encouraging — and mostly consistent with the connectivity framing that motivates underpass construction. Roads are unambiguously bad for wildlife; underpasses are almost certainly a net positive. But the cameras also captured a few anecdotes worth noting. A Cooper’s hawk was observed actively hunting birds inside one of the structures. After cover was added to encourage small animal use, snakes began moving into the modified underpasses — apparently to hunt. Whether the confined geometry of an underpass benefits predators more than prey in those moments is an open question. The structures that help animals cross may also, occasionally, give predators a geometric advantage they wouldn’t have in open habitat.
Turning 3 Million Images into Data
Collecting the images was the easy part. With 3.1 million frames and a taxonomically diverse species list, classification at scale was the central challenge.
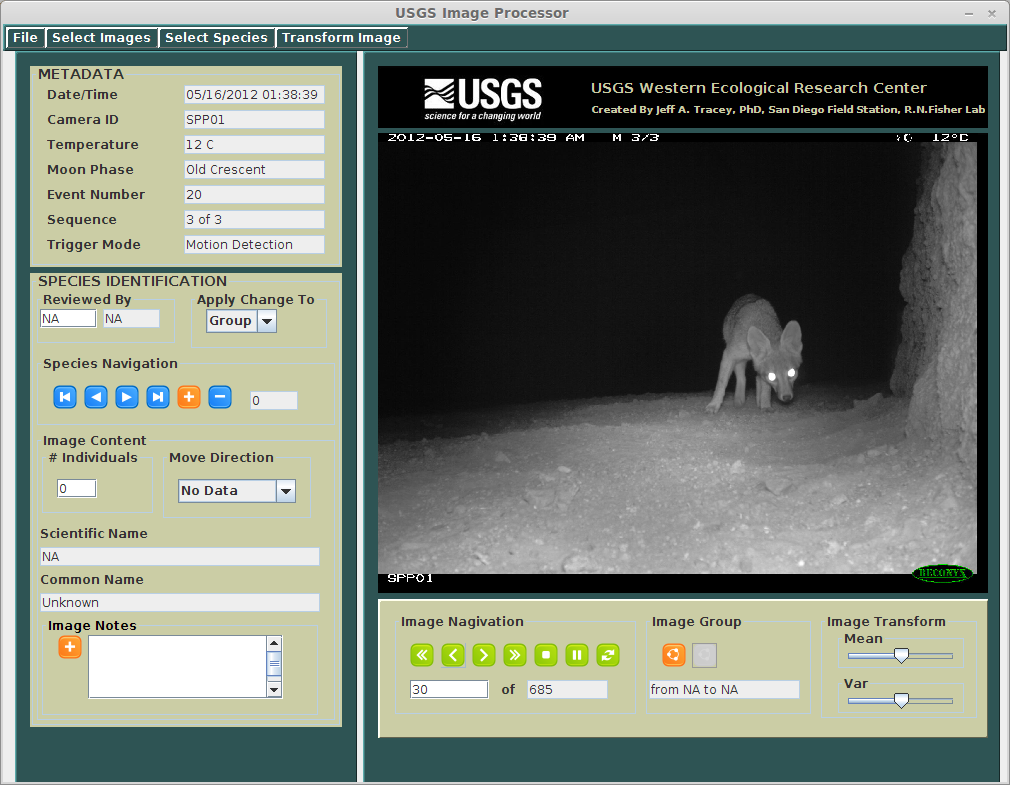
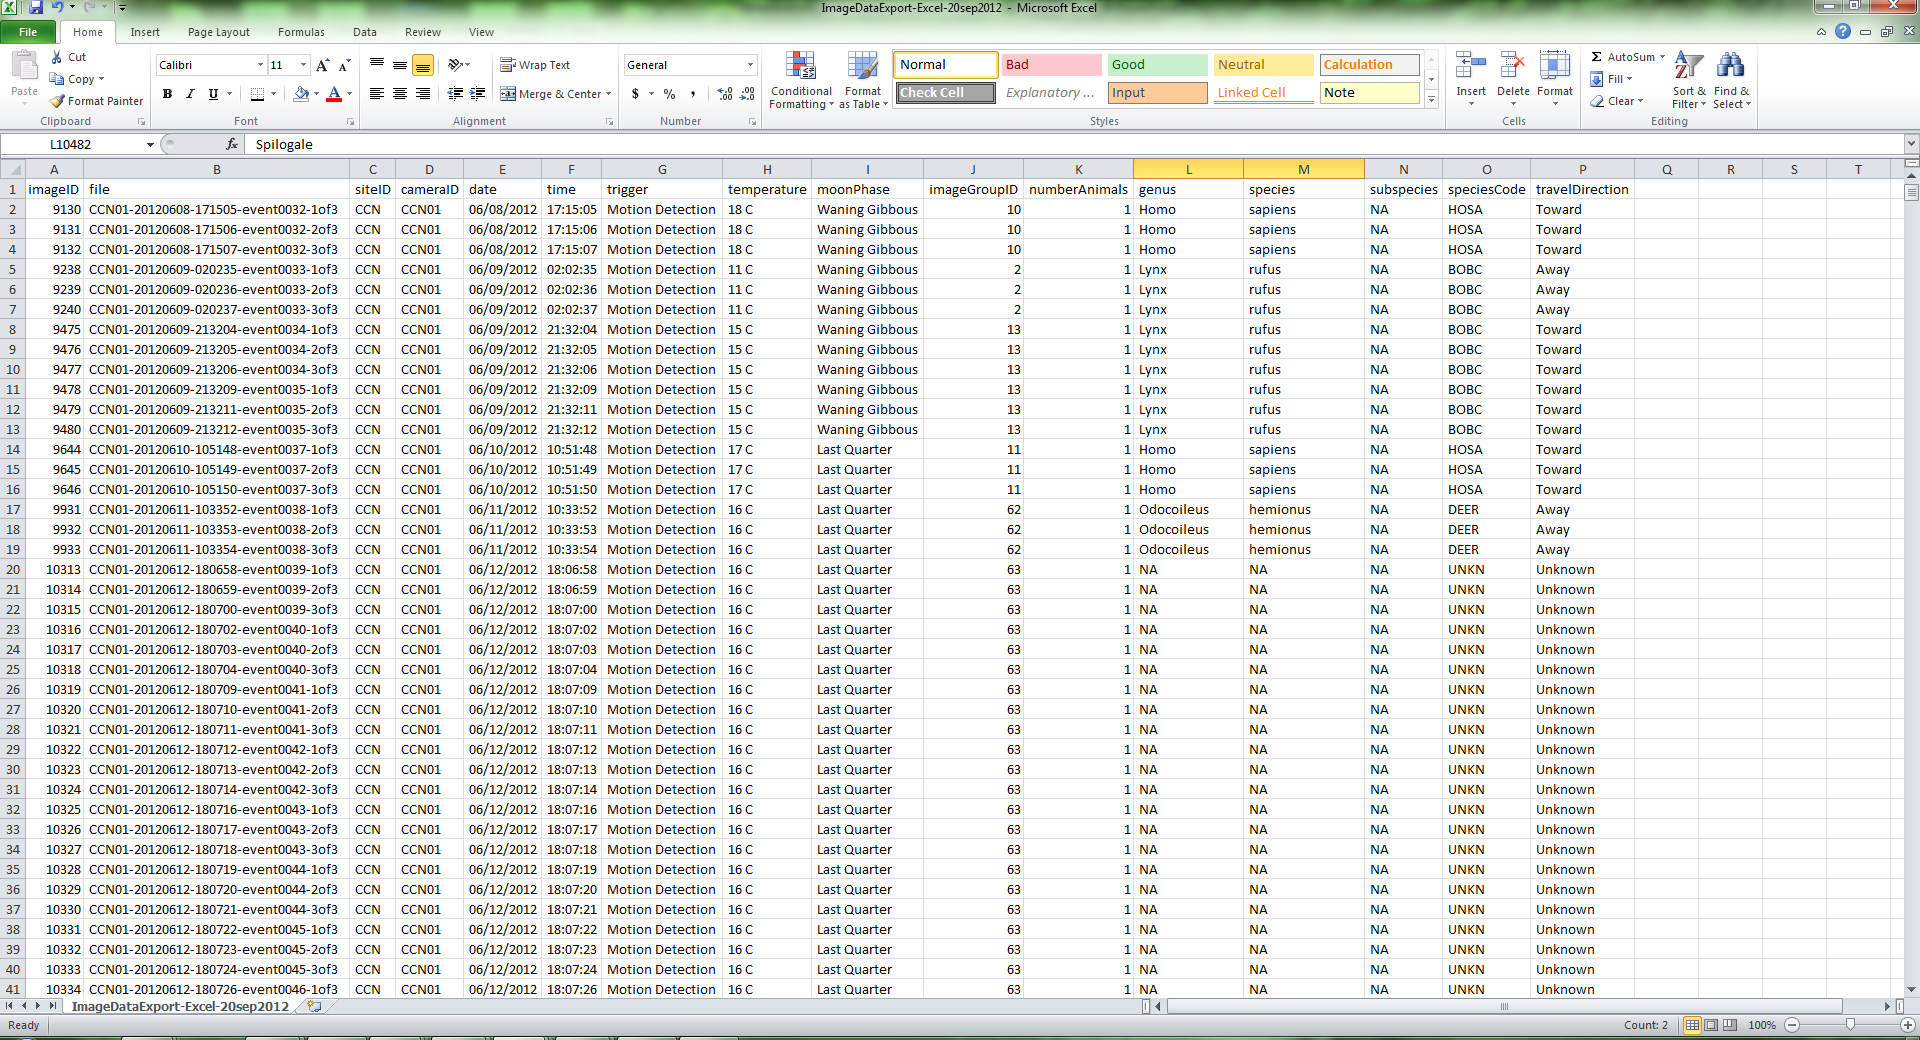
I wrote a custom Java application — the USGS Image Processor — to make manual classification tractable. The program loaded camera trap images in sequence, displayed the current frame alongside navigation controls, and let the user assign one or more species labels per image, record individual counts, and flag image quality. Completed sessions were exported as CSV files for analysis.
Even with the software, manual classification of millions of images was not feasible for one lab. I recruited a team of USGS field technicians and enlisted volunteer citizen scientists from the San Diego Tracking Team, who contributed substantial effort to working through the image backlog.
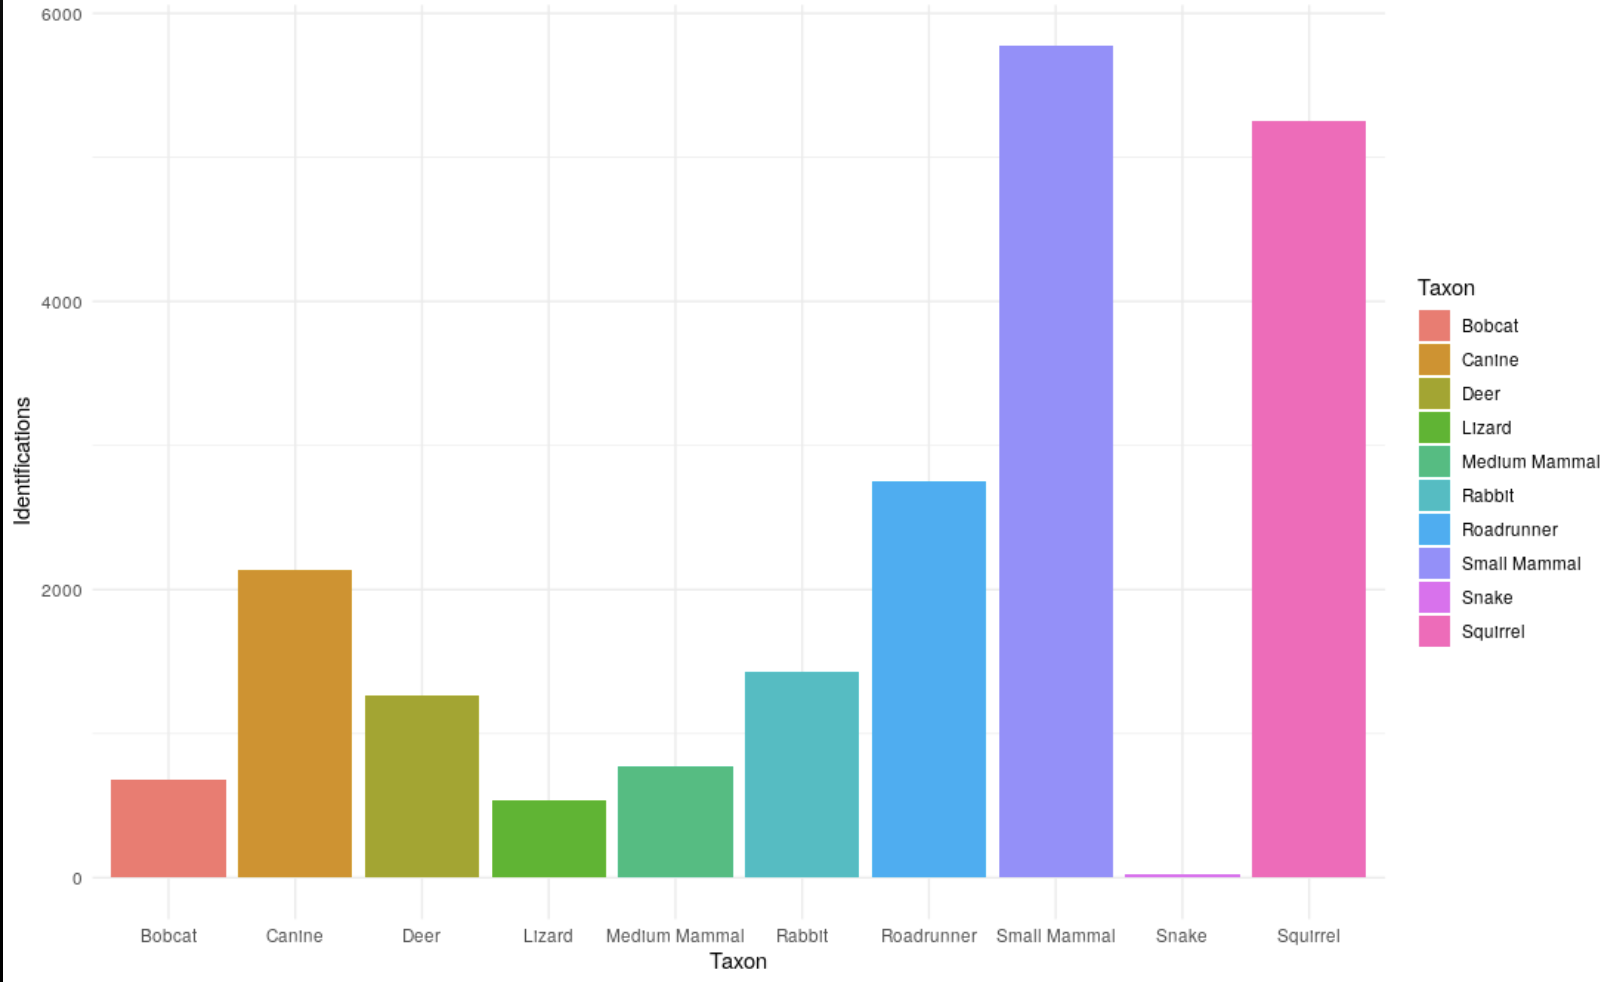
The result, after what I can only describe as a heroic collective effort: 152,594 labeled images — roughly 5% of the total dataset, and enough to support statistical analysis and, eventually, model training.
Statistical Analysis
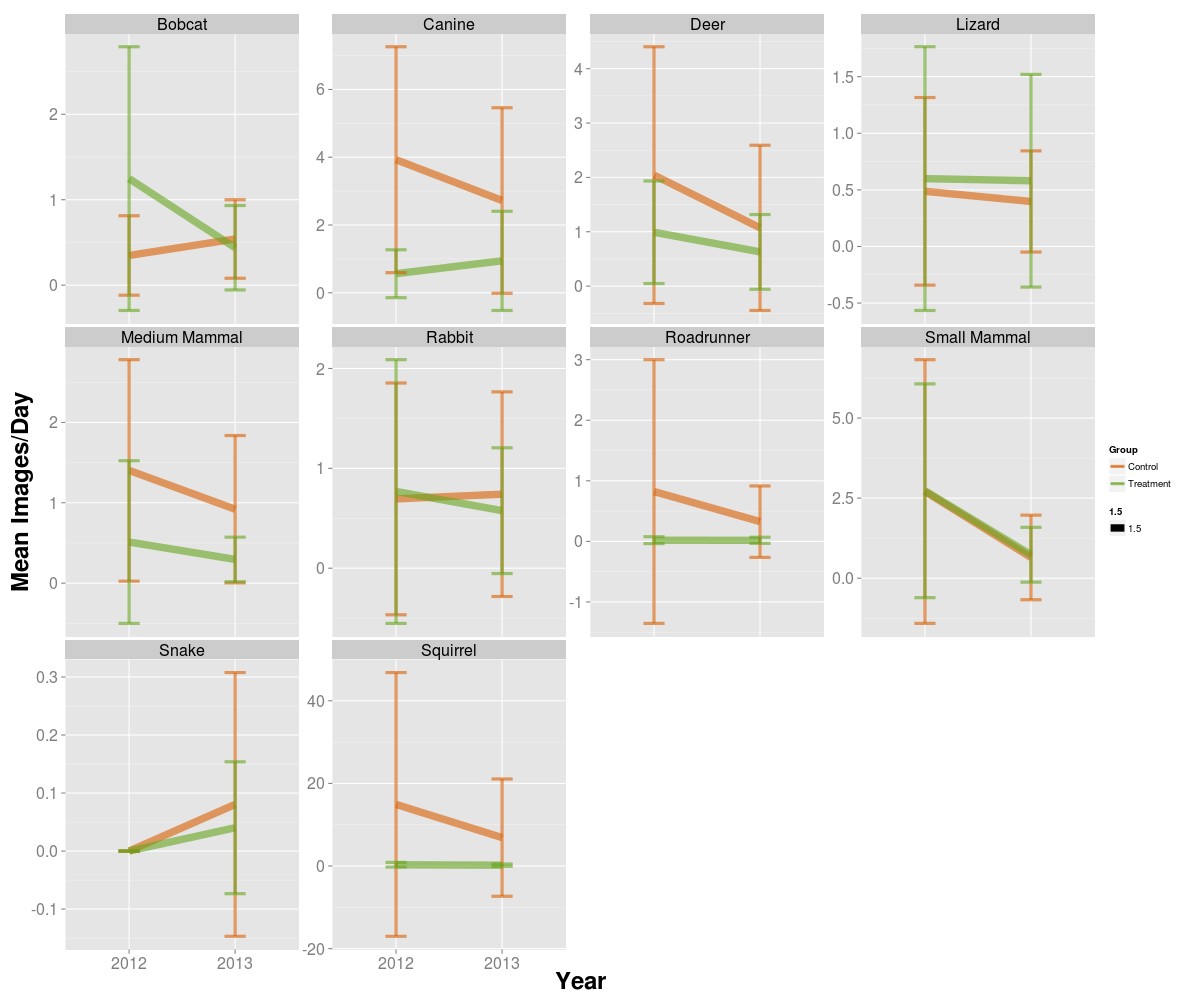
With the labeled dataset in hand, I analyzed species activity patterns using the BACI design. For each taxon, I fit mixed models estimating mean images per day as a function of treatment group (control vs. modified underpass), year (2012 vs. 2013), and their interaction — the key BACI term.
I also modeled species use of underpass interiors relative to the exterior approaches, and compared the species composition detected inside and outside the structures across sites.
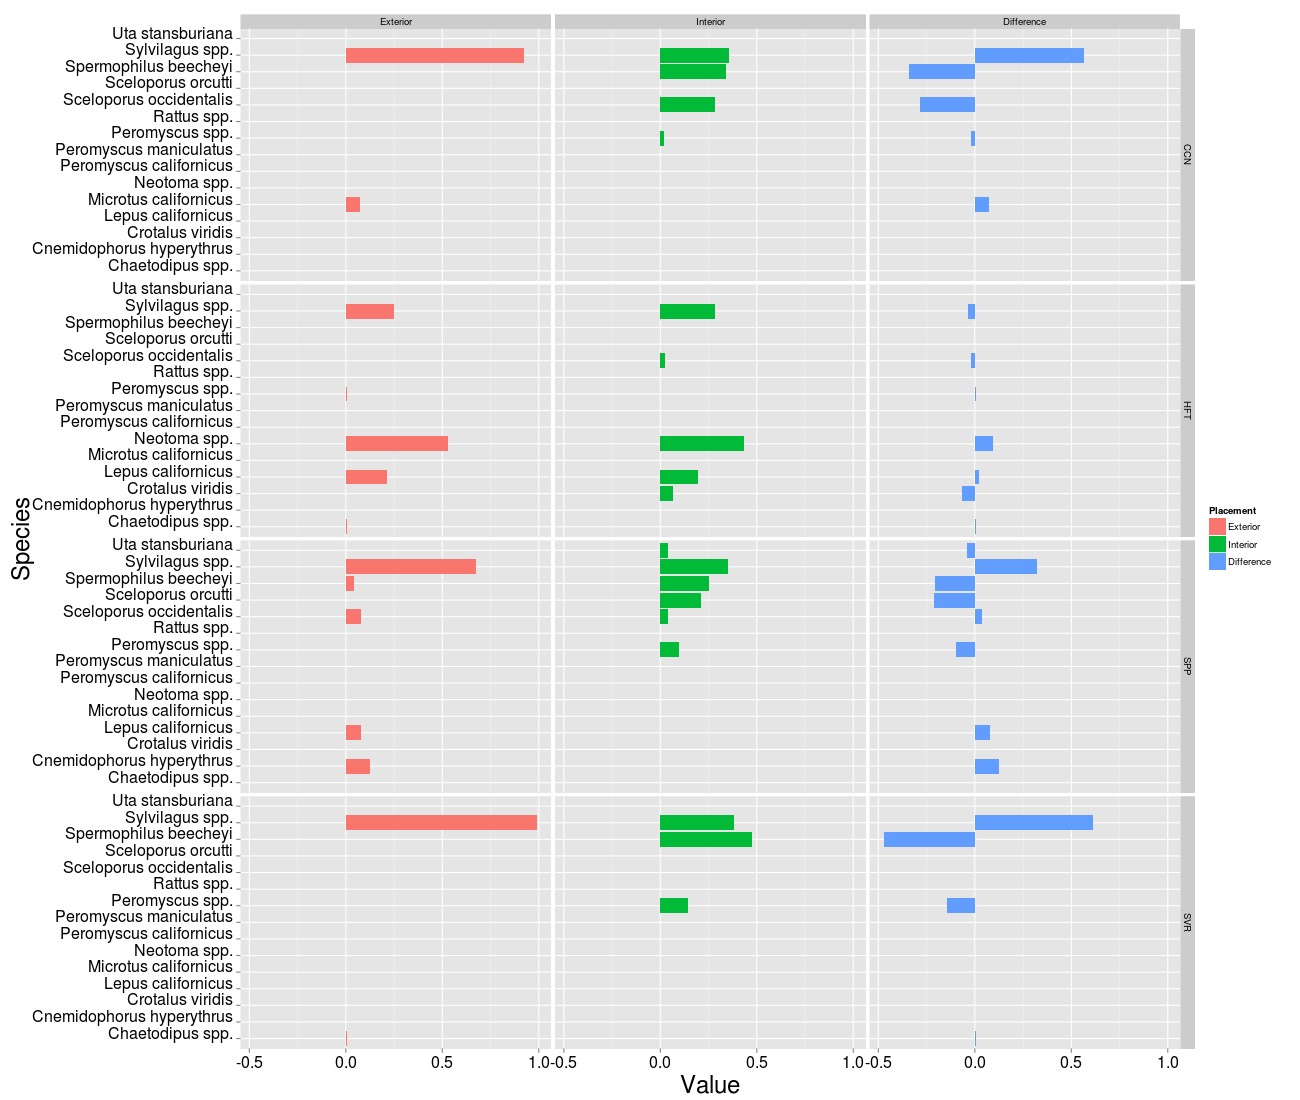
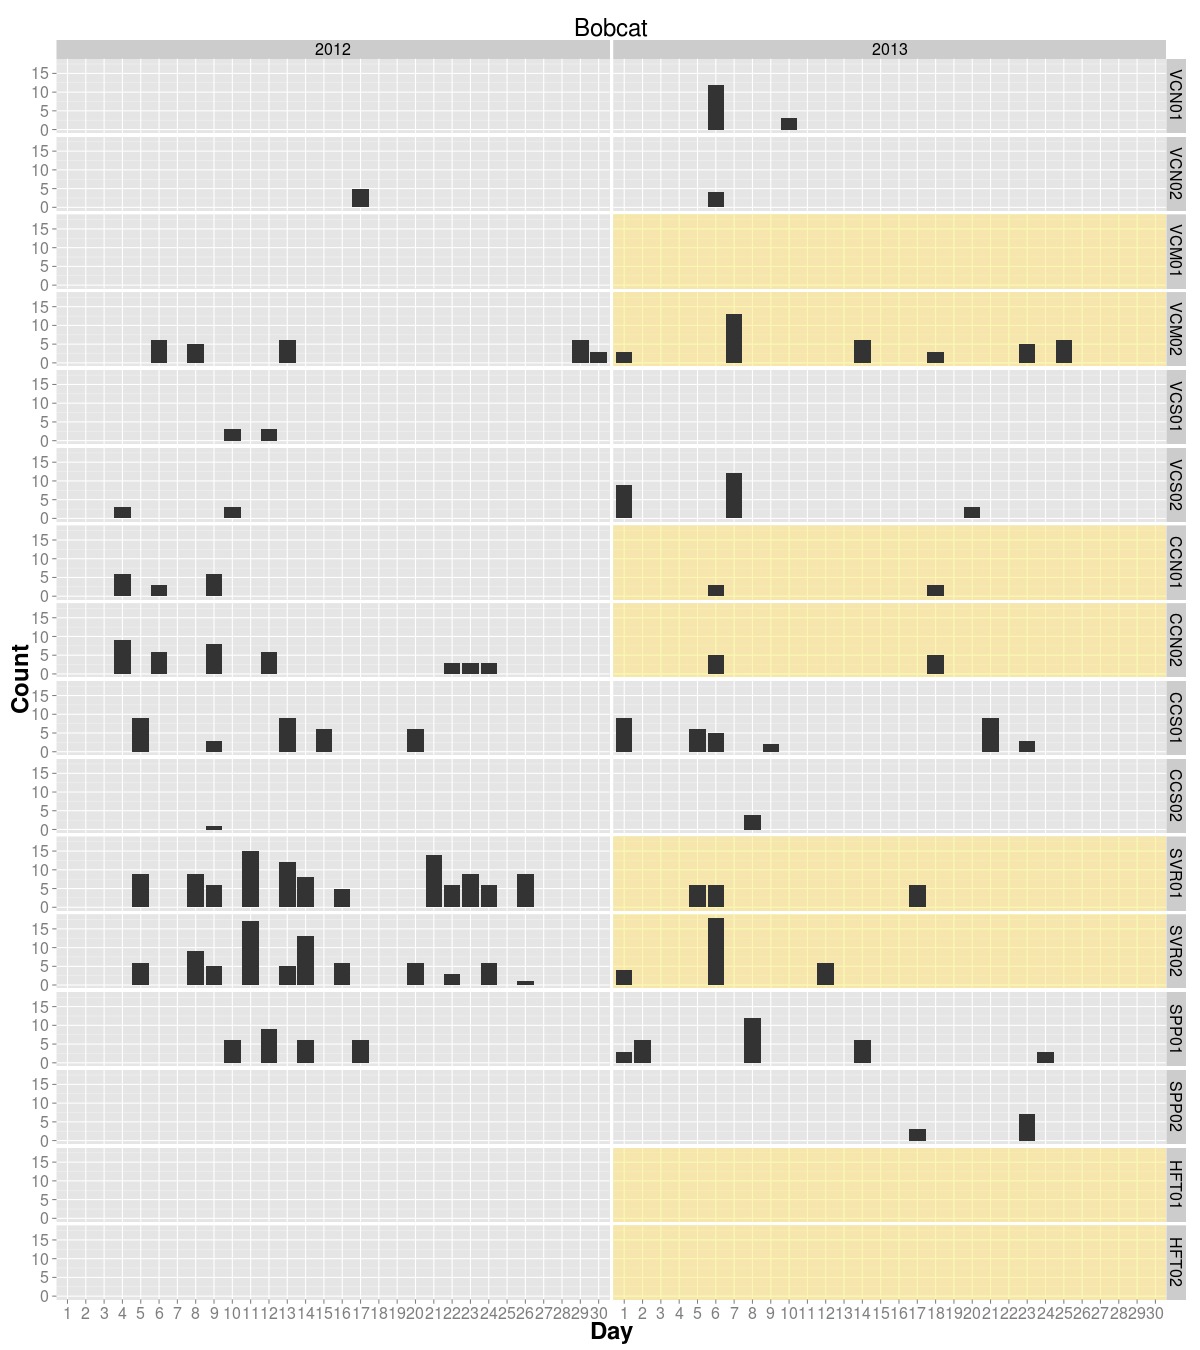
The site-level data told a sharper story for individual species. Bobcats, for example, used the underpasses regularly but not uniformly — two sites, SVR01 and SVR02, accounted for the majority of detections across both years.
From Camera Traps to Deep Learning
The labeled dataset covered only 5% of the images. The remaining 3 million were unclassified.
This was the moment that clarified something I had already suspected: manual classification, even with good software and volunteer labor, does not scale to modern camera trap deployments. The only path through the remaining images was automated classification — and that meant machine learning.
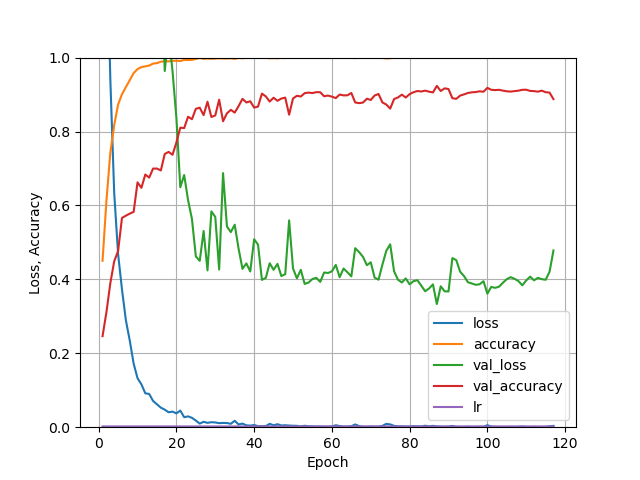
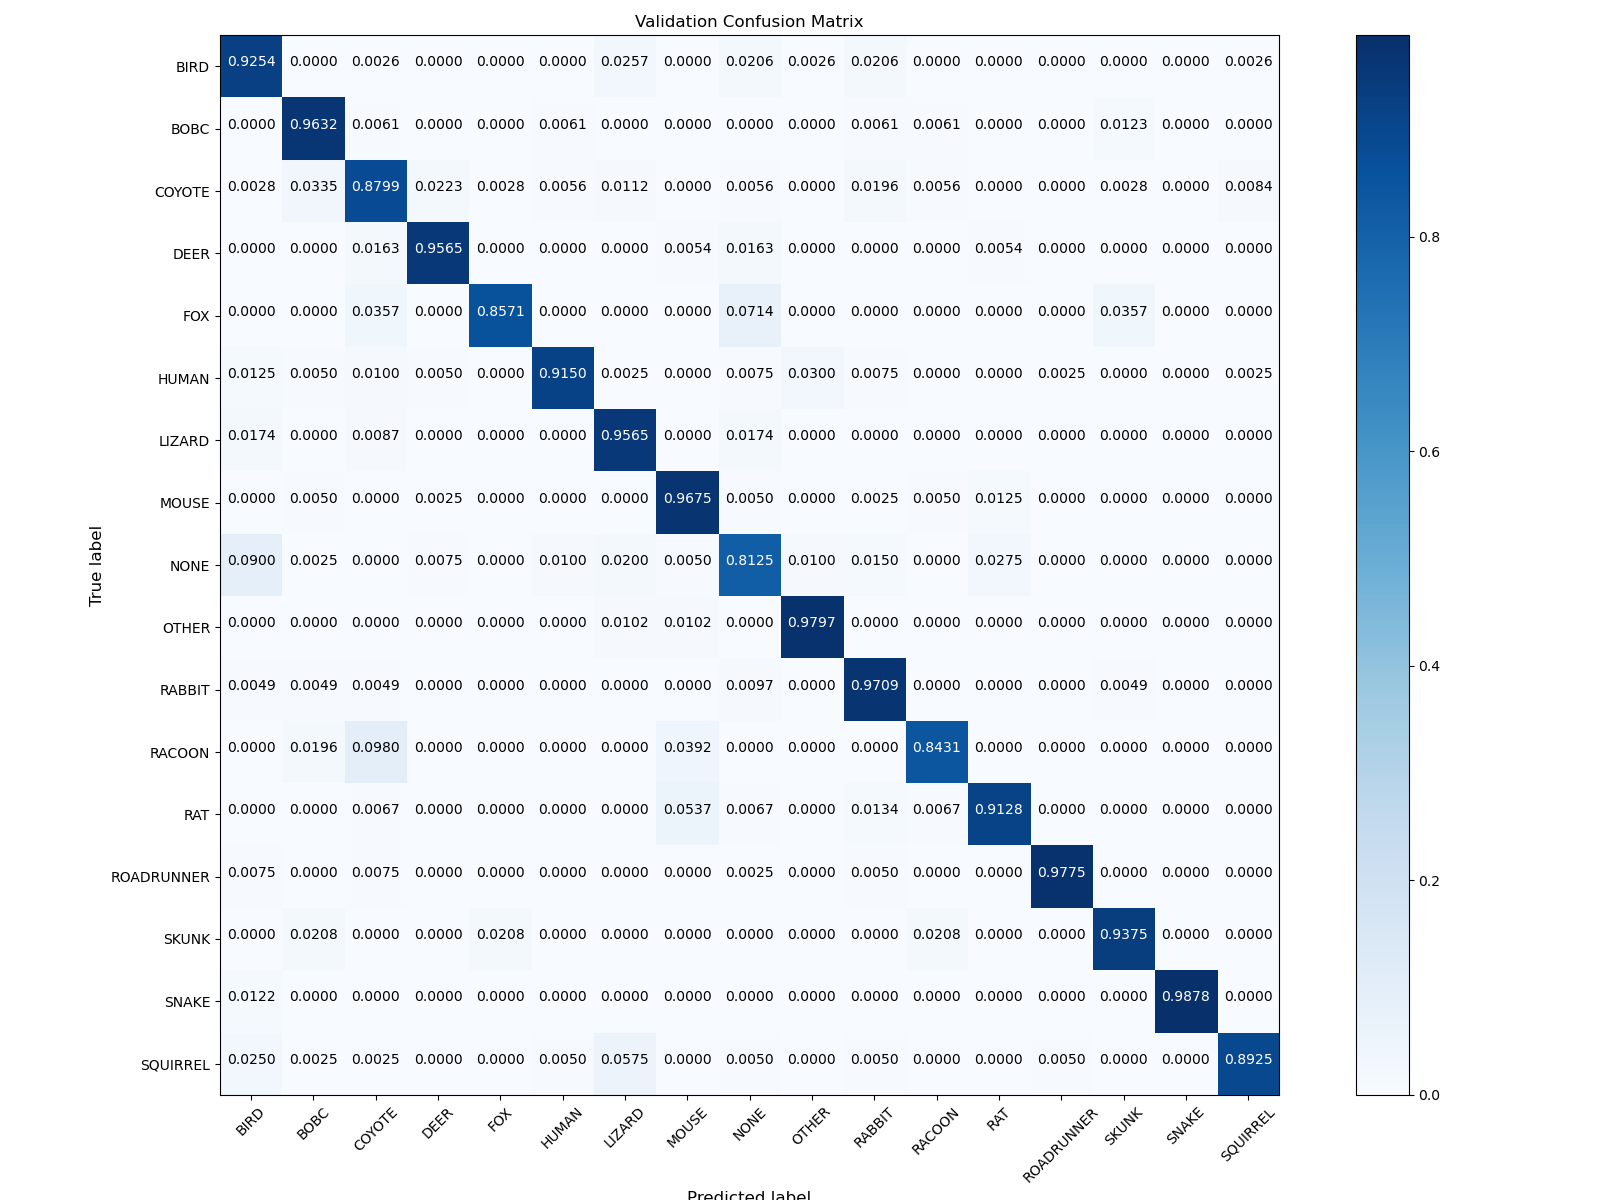
The deep learning work came later, after I moved to USGS Advanced Research Computing. I trained a ResNet50V2 convolutional neural network on the labeled dataset to classify images into 17 categories. The class imbalance problem that was visible in the label counts (squirrel: ~5,200 images; snake: ~50) required careful attention during training. Colleagues at WERC addressed the most severely underrepresented classes by supplementing the training set with images sourced from iNaturalist — adding labeled examples of rare taxa like snakes and lizards that the field cameras had captured too infrequently. That helped. The hyperparameter search included image augmentation strategies — random flips, rotations, scaling, blur, noise, color shifts, and others — to artificially expand the training set and improve generalization. Somewhat counterintuitively, the best-performing models used no augmentation at all.
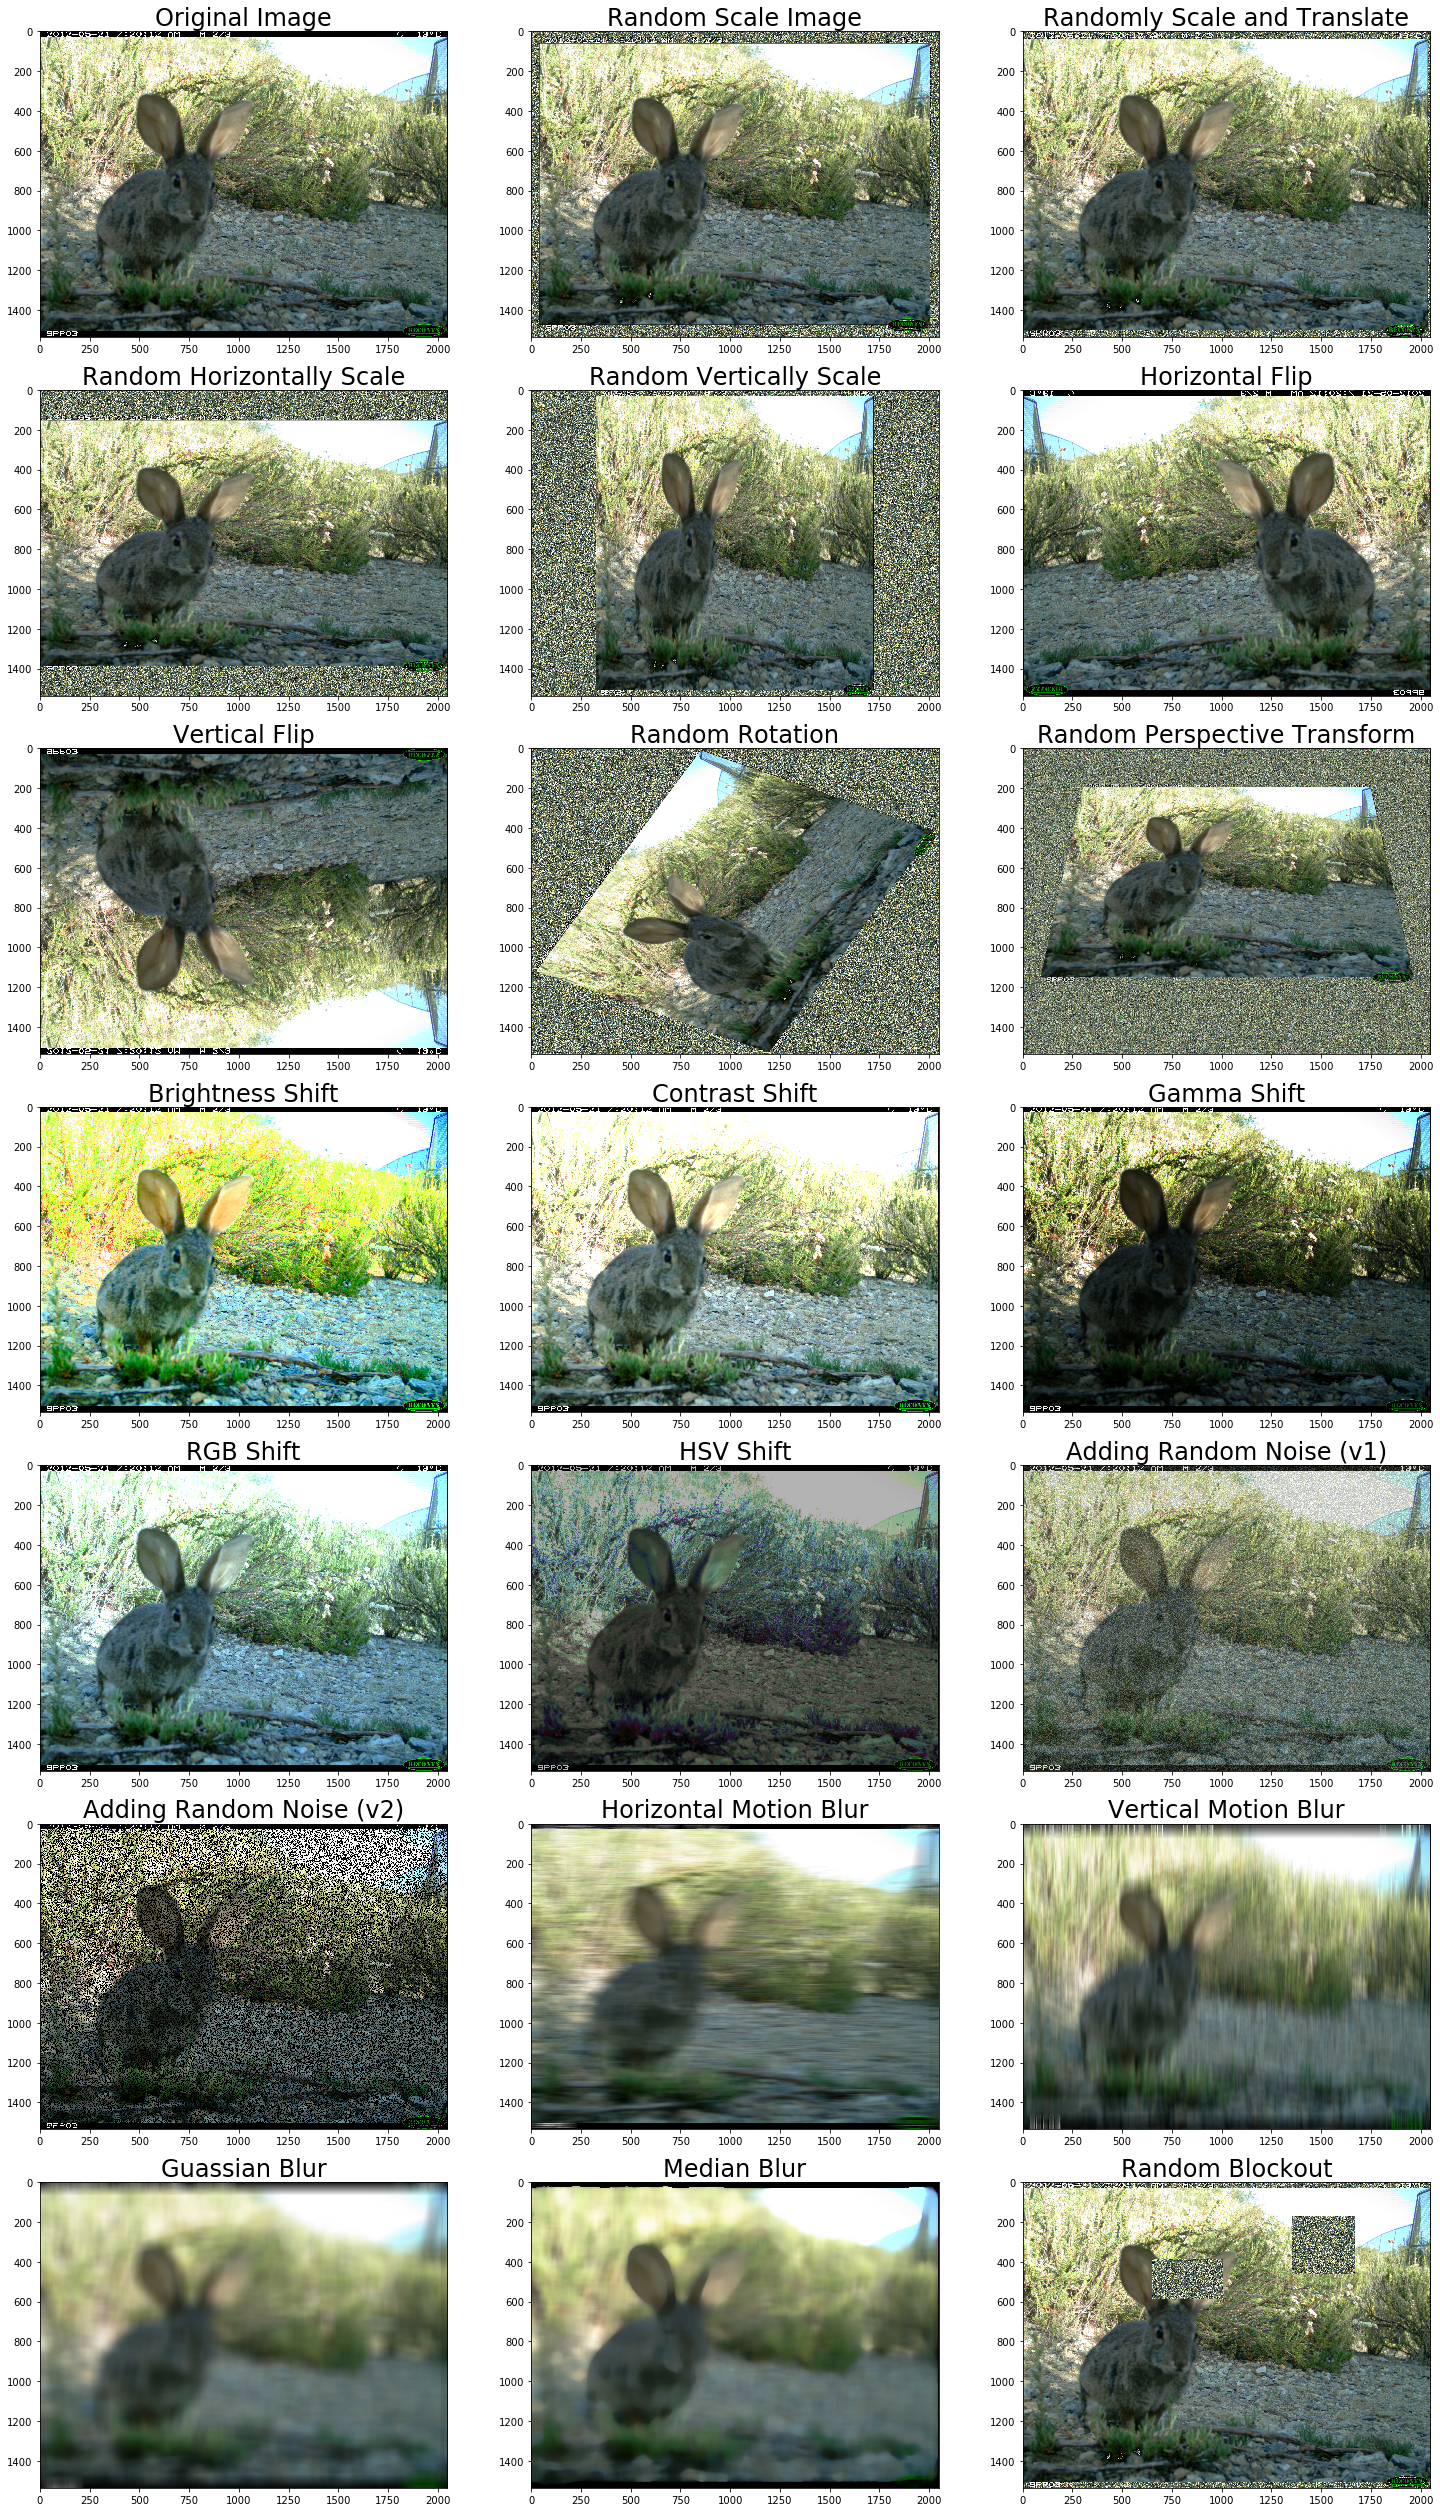
Thinking through why augmentation failed was useful in itself. For augmentation to help, the transformed images need to resemble conditions the model will actually encounter in the field — motion blur, brightness variation, and color shifts are all realistic for camera trap imagery, but aggressive spatial transforms are not. An equally important constraint was that spatial transformations could not crop the subject animal out of the frame. An image labeled RABBIT that contains only gravel is a mislabeled training example, and enough of those actively degrade model performance. Enforcing that constraint limited how aggressively spatial augmentations could be applied — and may partly explain why the unaugmented models won.
After a systematic hyperparameter search across 144 configurations, the best model achieved a mean F1 score of 0.916 across all 17 classes on the held-out validation set.
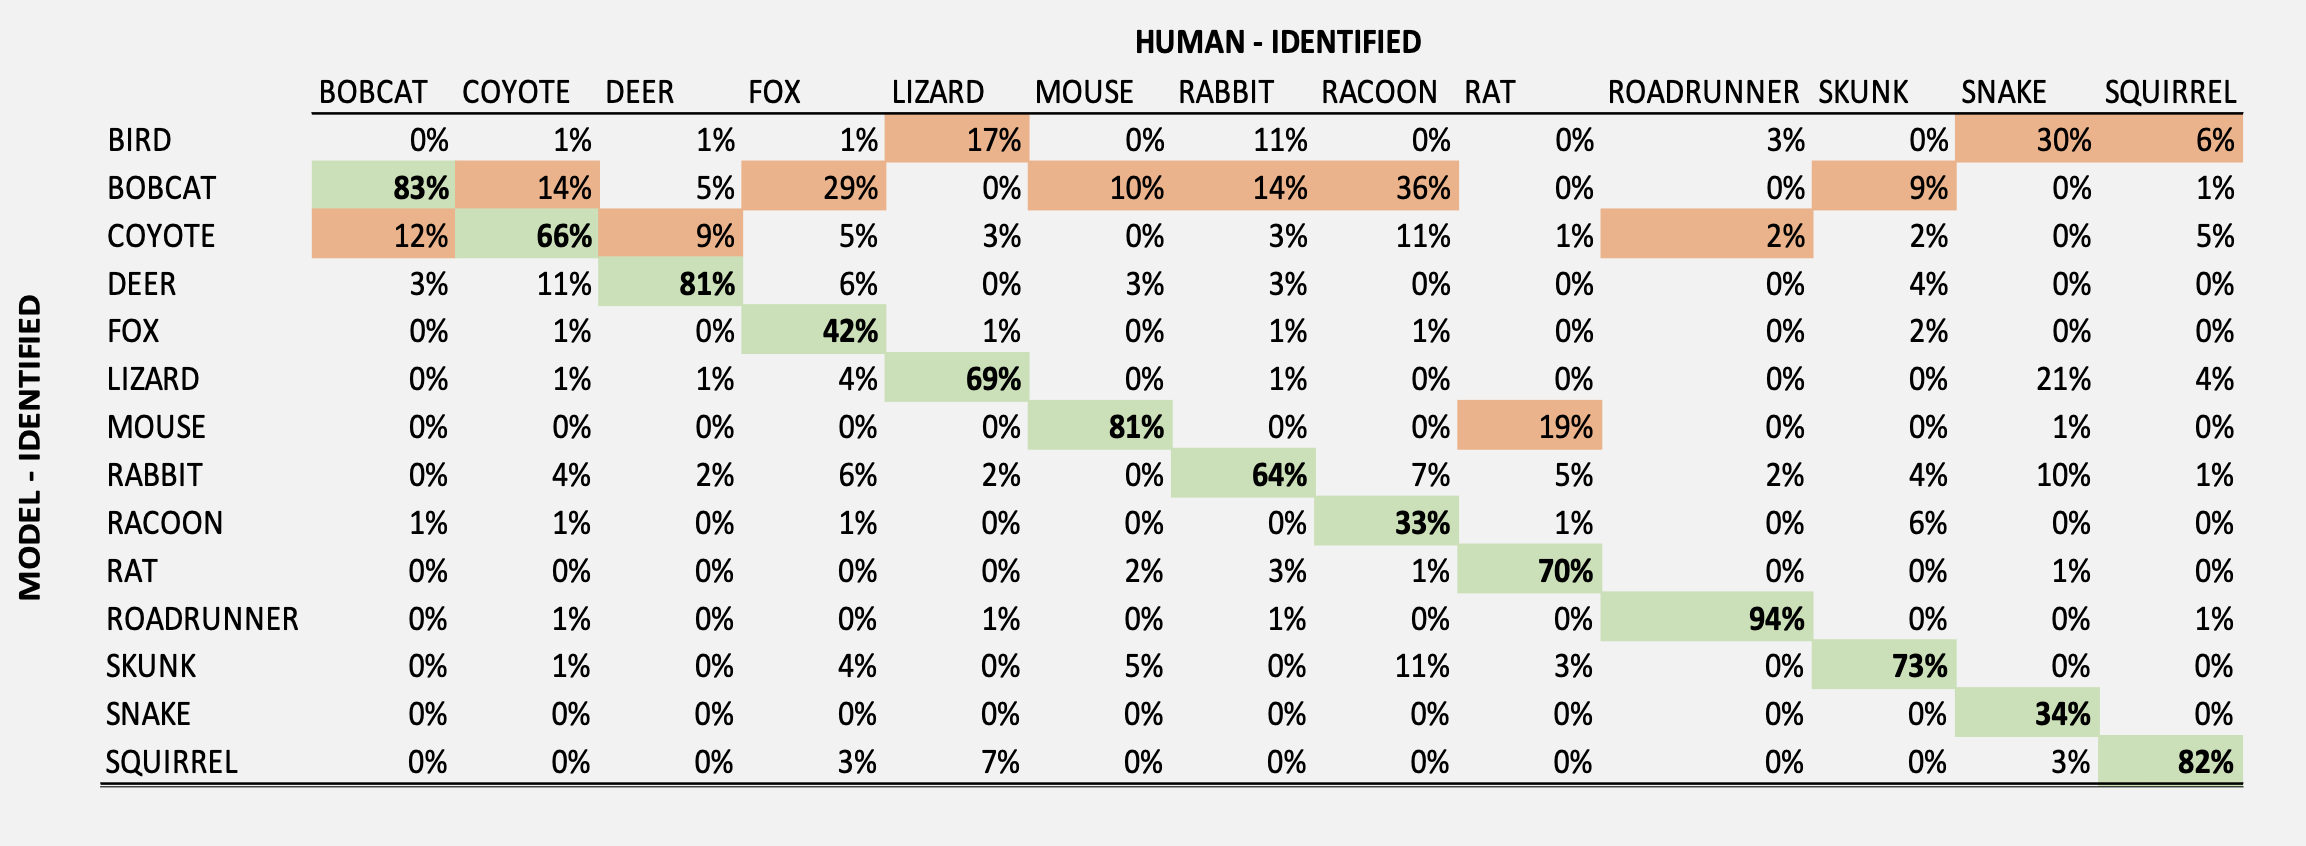
When the model was subsequently applied to the remaining 3 million unlabeled images and a subset of predictions were verified by human reviewers, overall accuracy was approximately 75% — lower than the validation F1, as expected when moving from a held-out test set to true field deployment, but strong enough to be genuinely useful. Performance varied by class: roadrunner reached 94%, bobcat 83%, squirrel 82%; rabbit and coyote were harder at 64% and 66% respectively. The gap between validation performance and deployment performance is itself an important finding — it is the honest cost of moving from a controlled benchmark to the wild.
This experience — the scale of the problem, the class imbalance, the gap between what manual effort could achieve and what the dataset required — is what convinced me that deep learning for wildlife image classification was not a novelty but a necessity. It set the direction for the research program that followed.
Bobcat Camera Study
Camera trapping for bobcats (Lynx rufus) in a separate collaborative study with Erin Boydston (USGS) and Kevin R. Crooks (Colorado State University). More to come.
Papers
Brehme CS, Tracey JA, Gould PR, Rochester CJ, Fisher RN (2022). Internal structures and ledges facilitate the use of large underpasses by multiple wildlife species and groups. USGS Cooperator Report to Nevada Department of Transportation, Transportation Pooled Fund Program Project P200-20-803. https://www.pooledfund.org/details/study/610
Brehme CS, Tracey JA, Ewing BAI, Hobbs MT, Launer AE, Matsuda T, Adelsheim EMC, Fisher RN (2021). Responses of migratory amphibians to barrier fencing inform the spacing of road underpasses: a case study with California tiger salamanders (Ambystoma californiense) in Stanford, CA, USA. Global Ecology and Conservation 31: e01857.
Brehme CS, Tracey JA, McClenaghan LR, Fisher RN (2013). Permeability of roads to movement of scrubland lizards and small mammals. Conservation Biology 27(4): 710–720. https://doi.org/10.1111/cobi.12081
Ascensão F, Grilo C, LaPoint S, Tracey J, Clevenger AP, Santos-Reis M (2014). Inter-individual variability of stone marten behavioral responses to a highway. PLoS ONE 9(7): e103544. https://doi.org/10.1371/journal.pone.0103544
Tracey JA, Brehme CS, Rochester C, Clark D, Fisher RN (2014). A Field Study of Small Vertebrate Use of Wildlife Underpasses in San Diego County, 2014. USGS Data Summary.
Tracey JA (2006). Individual-based modeling as a tool for conserving connectivity. In Crooks KR, Sanjayan M (eds.), Connectivity Conservation: Maintaining Connections for Nature. Conservation Biology Series, vol. 14. Cambridge University Press. https://doi.org/10.1017/CBO9780511754821.001