The Cognavitron — hover for details · click to navigate · double-click for full size
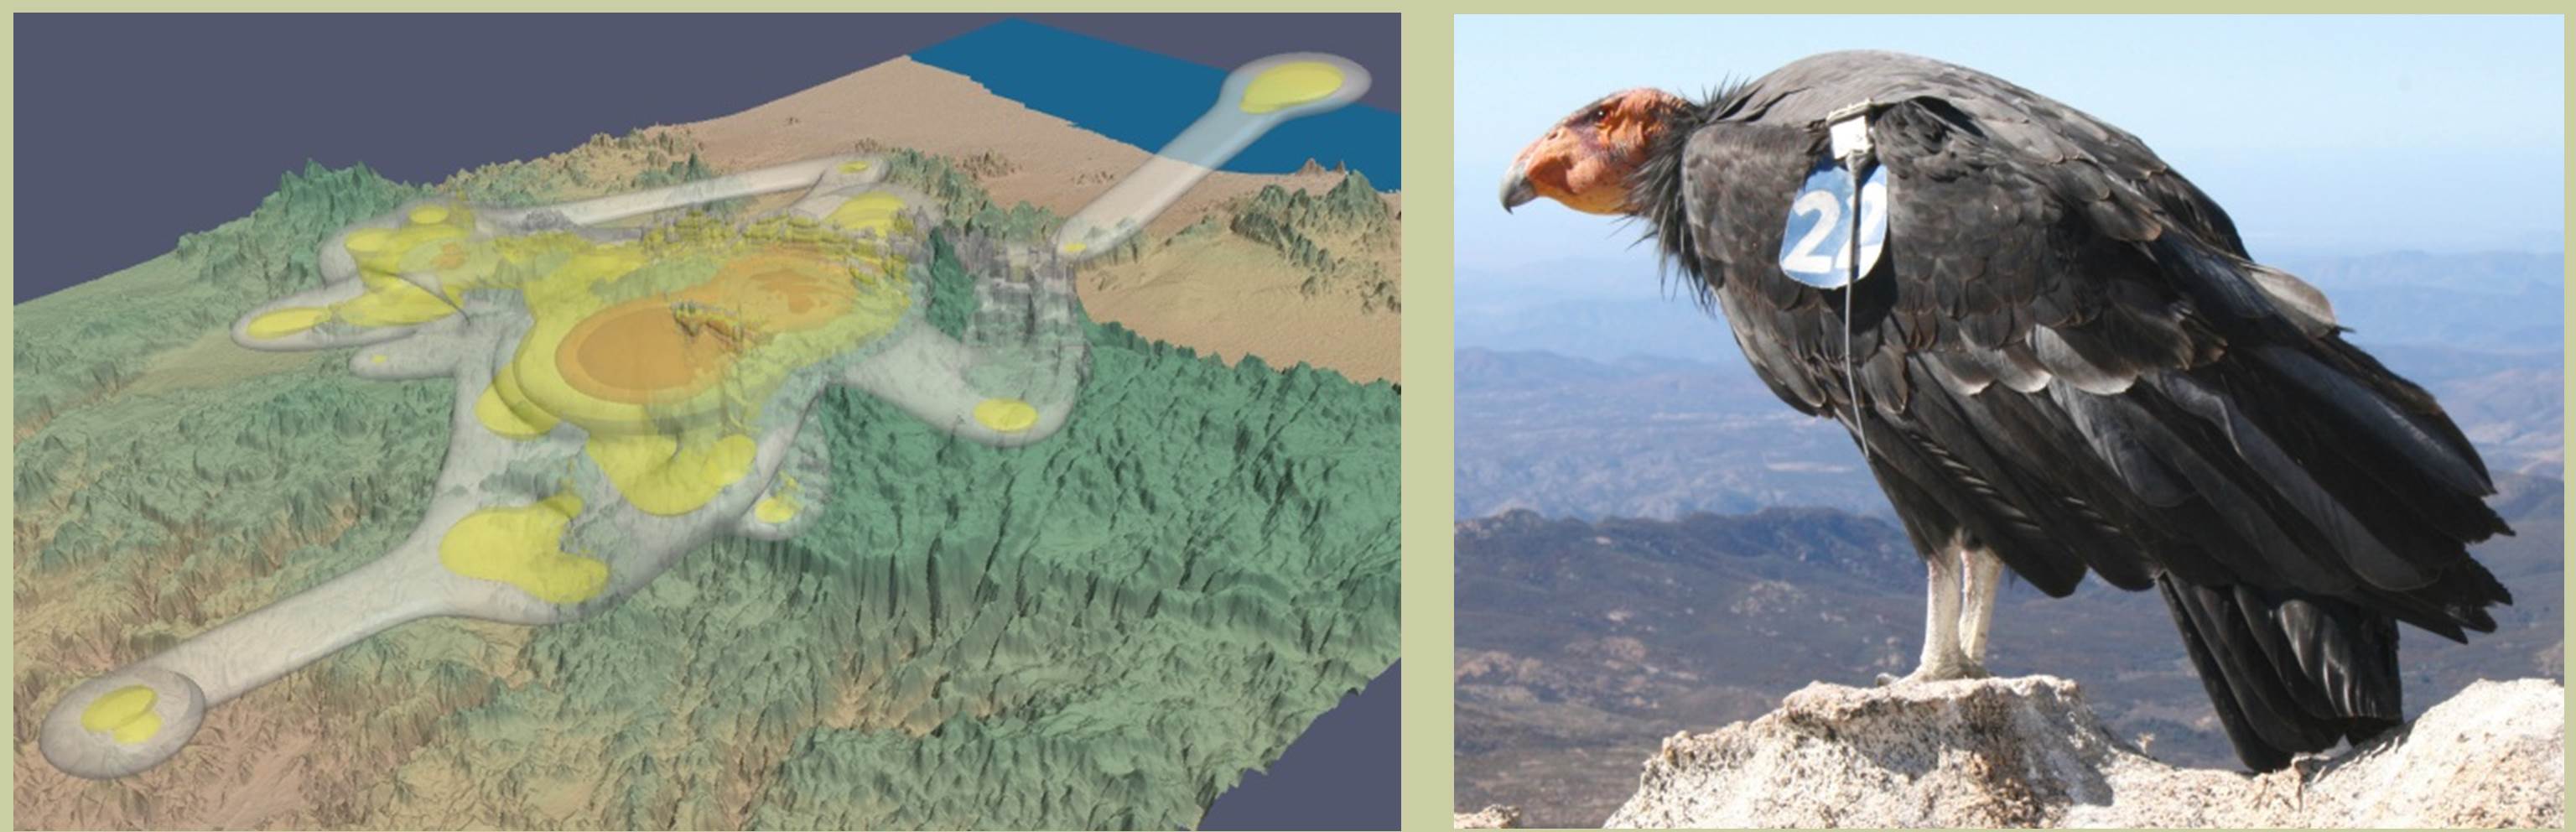
California Condors — 3D Space Use
2026-06-17
California Condors — 3D Space Use
Three-dimensional movement kernel density estimation for GPS-tracked California condors (Gymnogyps californianus). Extended MKDE methods to full 3D space to capture soaring and thermal use. Computationally intensive — required HPC cluster runs for large GPS datasets.
Background
Biotelemetry — placing tracking devices on animals to collect location data — lets ecologists understand which areas individual animals use. GPS tracking devices can collect hundreds or thousands of locations on a schedule chosen by researchers. But even with dense GPS data, we don’t know where an animal was between observations. This uncertainty matters: an animal may have used an area we never observed it in simply because we weren’t sampling at that moment.
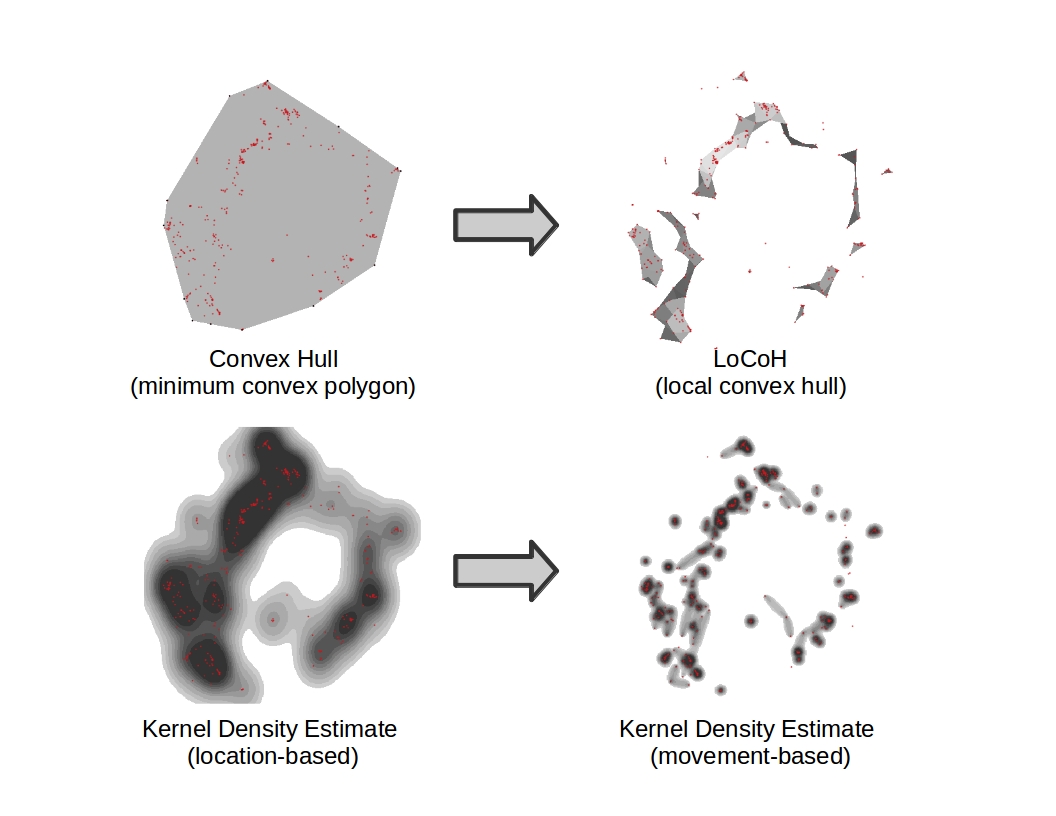
Ecologists have developed progressively better methods for estimating animal space use from location data. An early approach, still used today, is the minimum convex polygon (MCP) — equivalent to stretching a rubber band around all observed locations. The MCP is simple but includes many areas the animal never used. For nearly two decades after Worton (1989), kernel density estimation (KDE) based on observed locations was the standard approach. In 2007, two important advances followed: the LoCoH (local convex hull) method (Getz et al. 2007) greatly improved home range delineation over the MCP, and Horne et al. (2007) introduced a paradigm shift — estimating space use from an interpolated movement path between observed locations using a Brownian bridge, rather than from the locations themselves. This approach is called a movement-based kernel density estimate (MKDE), and it better captures areas an animal likely used during unobserved intervals.
All of these methods share a common limitation: they operate in two spatial dimensions. Some species, however, have an important vertical component to their space use. Until this project, very little work had extended 2D methods to handle full 3D location data.
Estimating Animal Space Use in 3D
James Sheppard and I initiated this project while he was at the San Diego Zoo’s Institute for Conservation Research (now San Diego Zoo Wildlife Alliance), extending the MKDE approach to three spatial dimensions. The motivation was the spatial ecology of reintroduced California condors (Gymnogyps californianus) and risks they face from wind energy development along the US-Mexico border. As the project developed, we brought in Robert Sinkovits from the San Diego Supercomputer Center (SDSC), a collaboration that soon expanded to include Amit Chourasia and Glenn Lockwood from SDSC. The methods, however, apply to any species that can be tracked with biotelemetry and has significant vertical movement — birds, marine mammals, sea turtles, arboreal species.

Methodology
We extend the Brownian bridge MKDE of Horne et al. (2007) to three spatial dimensions. The animal’s movement path is approximated by linear interpolation between observed locations. A trivariate kernel is integrated over time for each move step between consecutive locations. As time since the nearest observation increases — reaching its maximum at the midpoint between consecutive locations — the variance of the kernel increases, reflecting greater positional uncertainty. The model assumes equal variance in the x- and y-dimensions and a separate variance in the z-dimension, with additional parameters for observation error. Lower and upper barriers to movement in z can also be specified — for condors, the lower barrier is the earth’s surface.
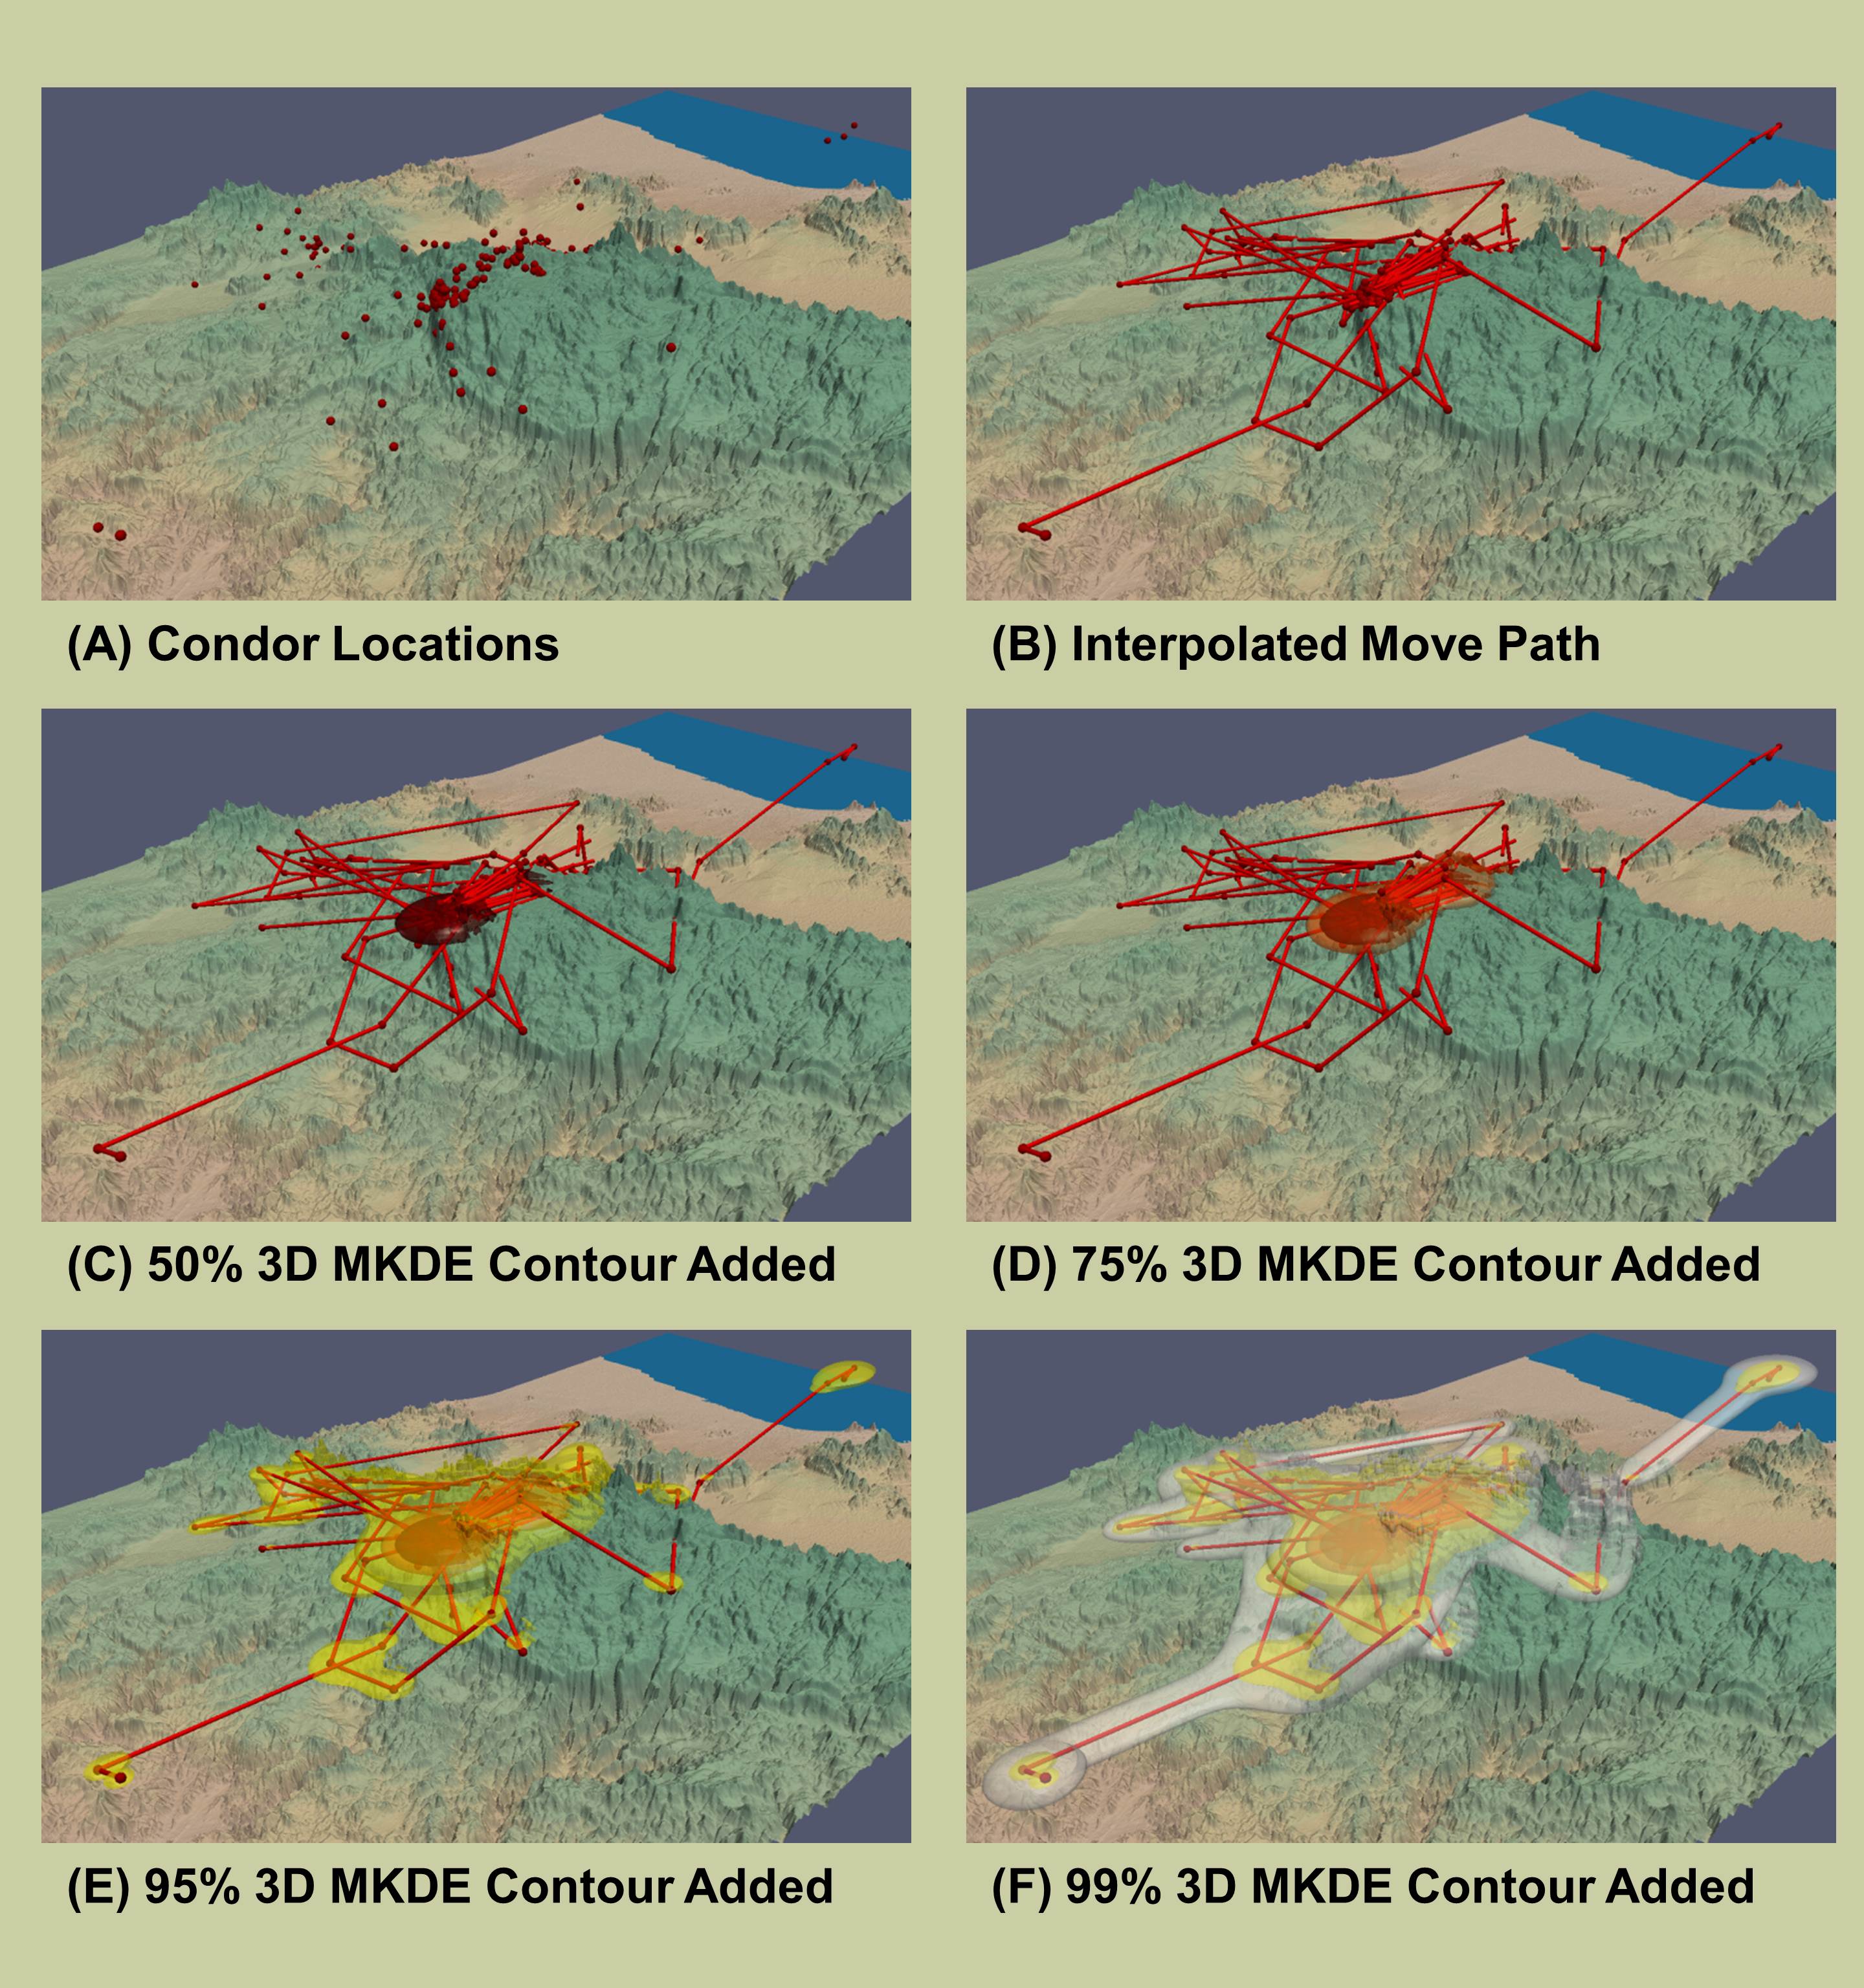
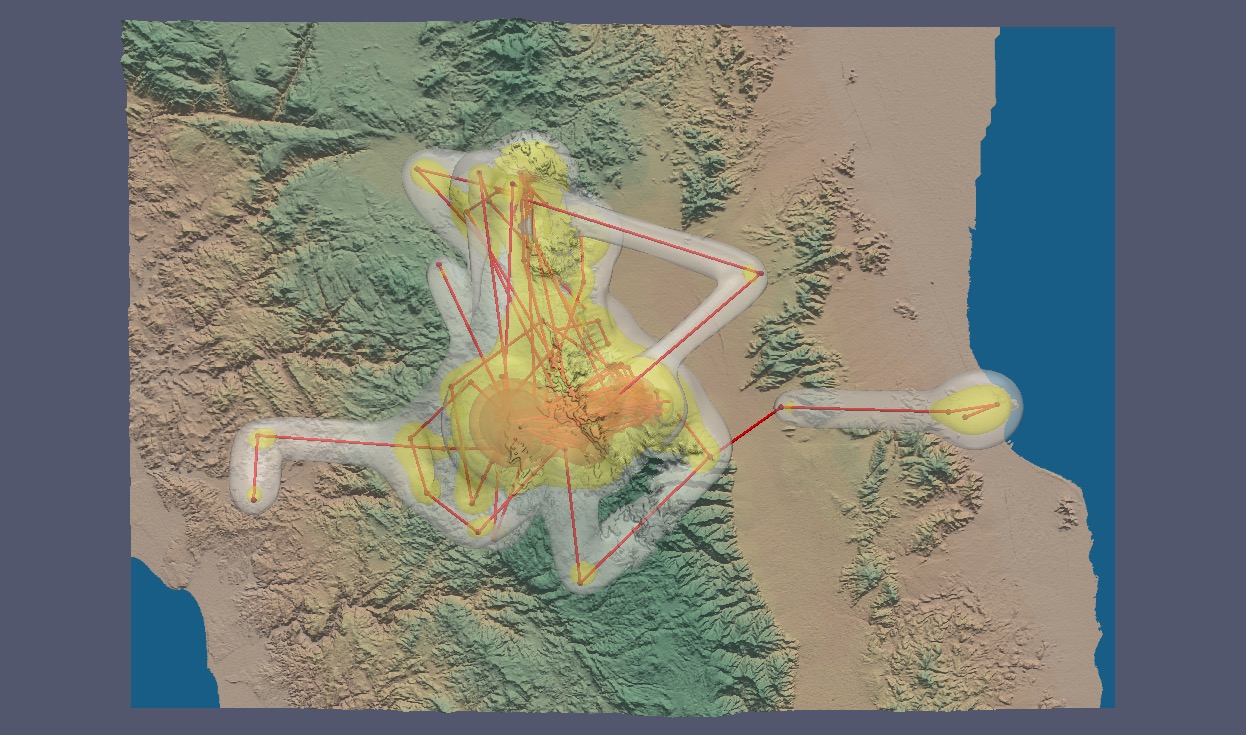
Once the 3D MKDE is calculated, contour surfaces at specified probability levels (e.g., 50%, 75%, 95%, 99%) describe the volume of space used with corresponding probability. These can be visualized in 3D using tools such as ParaView, VisIt, or Mayavi.
High-Performance Computing
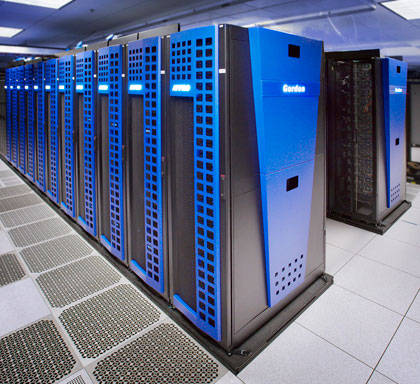
In 2014, we submitted a 3D MKDE animation for the XSEDE Visualization Showcase. Because we had to compute large 3D MKDEs over two-day time intervals, we processed them in parallel on the Gordon supercomputer at SDSC. After Robert (Bob) optimized the core C++ code, Glenn Lockwood and I parallelized the 3D MKDE computations using OpenMP. Once the MKDEs were computed, Amit Chourasia took the lead in creating the animation using VisIt software.
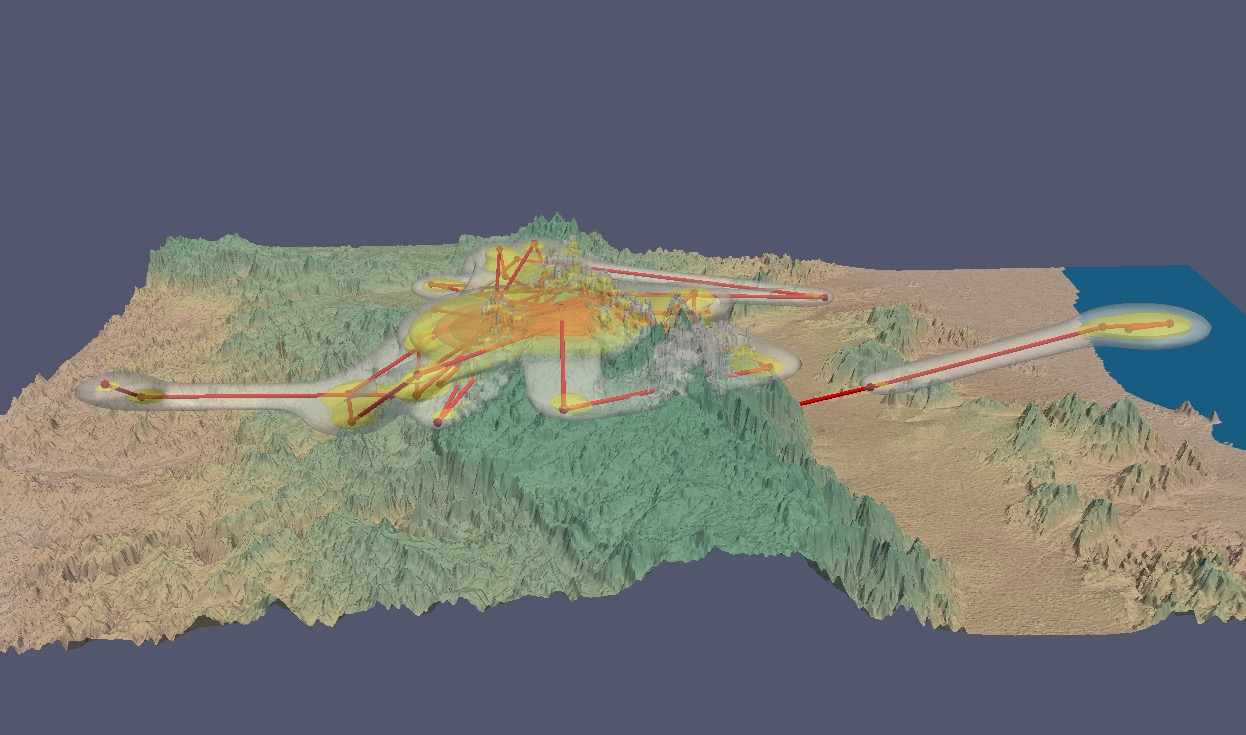
A paper describing the computational aspects of the methodology was presented at the XSEDE14 conference, along with an animation for the conference’s Visualization Showcase. In this visualization, 3D MKDEs for a breeding pair of California condors were calculated within a two-day moving window over several years on SDSC’s Gordon supercomputer and animated using VisIt software.
3D MKDE home ranges for a pair of California condors (Gymnogyps californianus), animated over a moving time window. The volumetric space use estimates capture both horizontal and vertical dimensions of flight — condors regularly soar above 1,500 m. Computed in collaboration with the San Diego Supercomputer Center. (Visualization: J. A. Tracey, J. K. Sheppard, R. Sinkovits, and A. Chourasia)
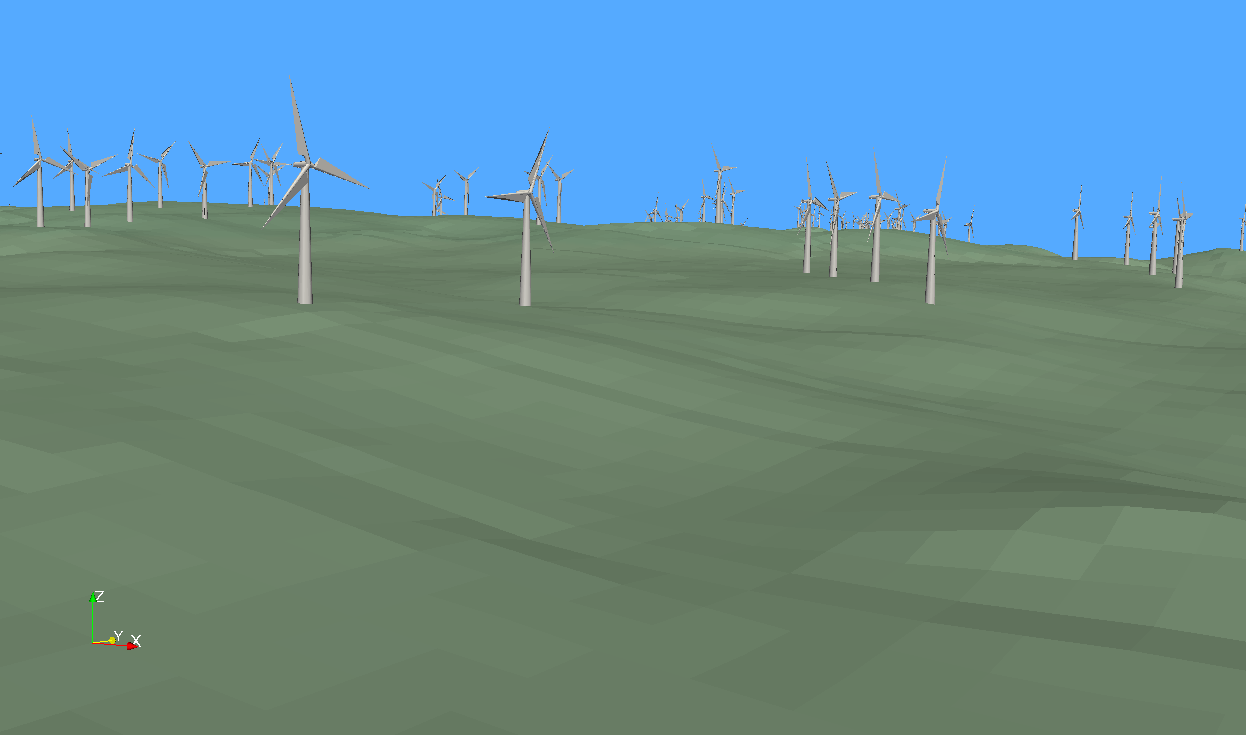
A Sempra wind farm proposed for construction in Baja, Mexico (now built) overlapped an area used by a condor reintroduced in Baja by the San Diego Zoo Wildlife Alliance. One bird flew through the proposed installation area in 2007. We constructed 3D models of the proposed wind farm to visualize, in 3D, the condor’s movement route in relation to the turbines.
Software
This work produced the mkde R package, which I developed in collaboration with James Sheppard, SDZG, and SDSC. The package provides functions for setting up animal location data, estimating MKDE variance parameters, creating MKDE objects, computing the MKDE, and exporting output files. Joint space-use between two animals based on spatiotemporal overlap of their MKDEs is also implemented. Output can be exported in VTK and XDMF formats for 3D visualization in ParaView, VisIt, and Mayavi. The package supports both 2D and 3D MKDE calculation and is now maintained by SDSC.
Products
- R Package:
mkdeon CRAN - Paper: Tracey JA, Sheppard J, Zhu J, Wei F, Swaisgood RR, Fisher RN (2014). Movement-Based Estimation and Visualization of Space Use in 3D for Wildlife Ecologyand Conservation. PLOS ONE 9(7): e101205. https://doi.org/10.1371/journal.pone.0101205
- XSEDE14 Proceedings Paper: Tracey JA, Sheppard JK, Lockwood GK, Chourasia A, Tatineni M, Fisher RN, Sinkovits RS (2014). Efficient 3D movement-based kernel density estimator and application to wildlife ecology. Proceedings of the 2014 Annual Conference on Extreme Science and Engineering Discovery Environment, pp. 1–8. https://doi.org/10.1145/2616498.2616522
- XSEDE14 Visualization Showcase: Animated 3D MKDEs for a breeding condor pair
References
Getz WM, Fortmann-Roe S, Cross PC, Lyons AJ, Ryan SJ, et al. (2007) LoCoH: Nonparametric Kernel Methods for Constructing Home Ranges and Utilization Distributions. PLoS ONE 2(2): e207. https://doi.org/10.1371/journal.pone.0000207
Horne JS, Garton EO, Krone SM, Lewis JS (2007) Analyzing animal movements using Brownian bridges. Ecology 88(9): 2354–2363.
Worton BJ (1989) Kernel methods for estimating the utilization distribution in home-range studies. Ecology 70(1): 164–168.
Collaborators
- James K. Sheppard, Ph.D. — San Diego Zoo Wildlife Alliance, Institute for Conservation Research
- Robert Sinkovits and the San Diego Supercomputer Center
Press
- Condor Conservation in Three Dimensions — Earthzine